
Figure 3.
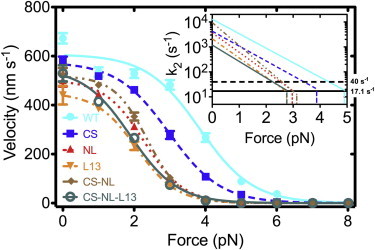
The velocity of each motor as a function of applied force. (Lines) Fits to the data by the three-state kinetic model. (Inset) Mechanical rate (k2) versus F (Eq. 2) in log-normal scale. (Thick horizontal solid line) Average mechanical rate at stall for all motors (17.1 s−1; k2stall in Table S1 shows individual values). (Thick horizontal dashed line) Rate-limiting biochemical step for Kin-1 (40 s−1). The system becomes mechanically limited above the force at which k2 crosses this line (see Text S2 in the Supporting Material). (Thin vertical lines) Stall force of each motor.