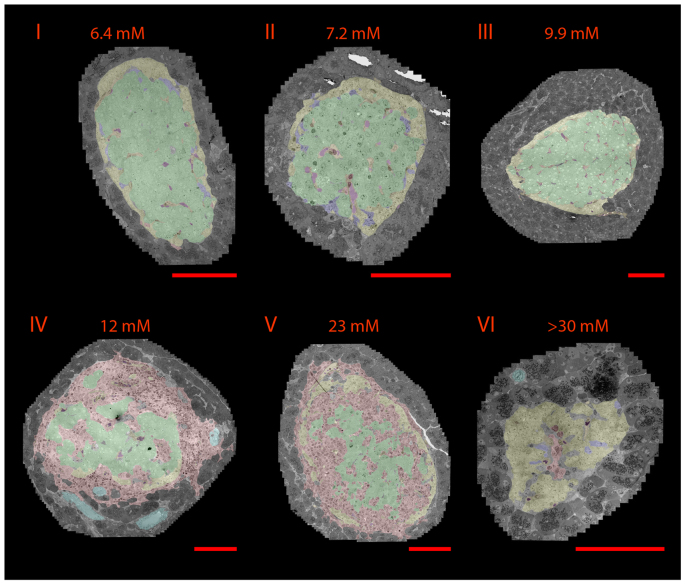
Figure 2. Analysis of Islets of Langerhans during autoimmune diabetes progression.
Automated acquisition and stitching of an entire Islet section allows analysis at different levels of magnification. Individual cells were morphologically characterized and false-colored according to cell-type (outlined in Methods): green (beta cells), yellow (alpha cells), red (leukocytes), purple (ducts) and cyan (vasculature). (I) Diabetes resistant rat; (II)–(VI) diabetes prone rat at different stages of (pre)diabetes, as indicated by the blood sugar (BG) levels. Note the massive infiltration of leukocytes (red) and destruction of beta cells (green). Bars: 0.1 mm. For full resolution, visit www.nanotomy.nl.

