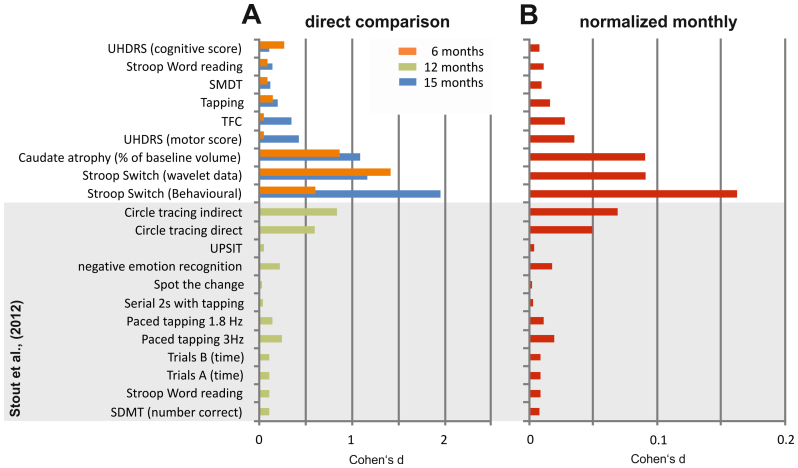
Figure 5.
(A) Histograms of the Cohen's d effect sizes. Blue bars indicate the effect sizes obtained in the 15-month period; orange bars indicate effect sizes obtained in the current study in the 6-month period between the 15-month and 21-month endpoints. Green bars indicate effect sizes that were calculated based on the neuropsychological data in Stout et al.21. Note that for the Stout et al.21 data, the direction of longitudinal performance development is not coded. (B) Cohen's d effect sizes were normalized monthly. Normalization was calculated on the basis of the 15-month longitudinal data (this study) and the 12-month longitudinal data from the Stout et al.21 study.

