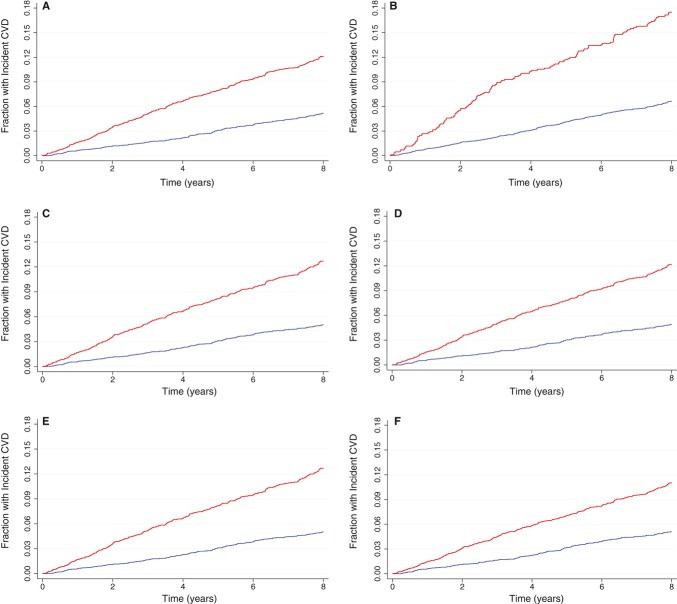
Figure 1.
Kaplan‐Meier curves depicting the probability of developing a cardiovascular event as a function of time for the different plaque metrics (absence of plaque is the blue line; presence of plaque is the red line): (A) any plaque,10 (B) stenosis ≥25%,12 (C) median of maximum ICA IMT,13 (D) any plaque or maximum IMT >1.5 mm,7,11 (E) maximum ICA IMT >1.5 mm,8 and (F) median of mean of maximum IMT.15 ICA indicates internal carotid artery; IMT, intima‐media thickness; CVD, cardiovascular disease.

