
Figure 1. The hexosamine/O-GlcNAc pathway modulates cellular clock oscillation.
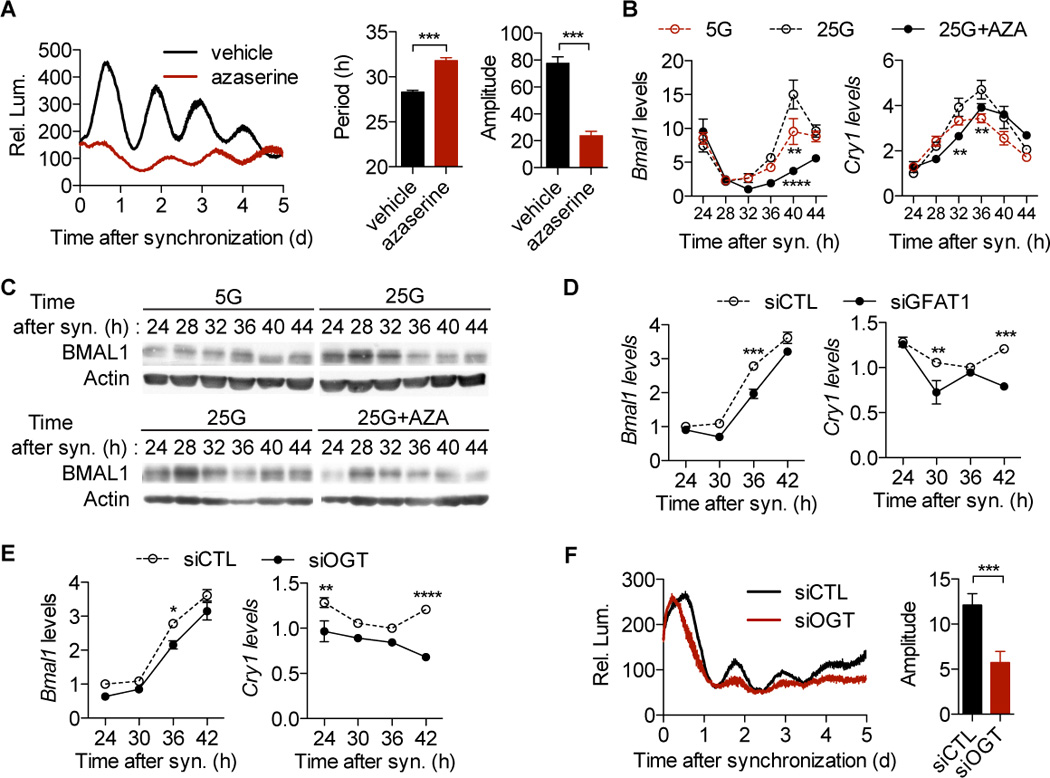
(A) Average real-time bioluminescence from synchronized U2OS-B6 cells stably expressing a Bmal1:luc construct in the presence or absence of azaserine (n = 5). The vertical bar represents relative luminescene (Rel. Lum.). Circadian parameters were calculated by JTK_CYCLE. (B) RT-qPCR analysis of synchronized U2OS-B6 cells (n = 3). 5G/25G, 5/25 mM glucose; AZA, azaserine. (C) Immunoblot analysis of synchronized U2OS-B6 cells (n = 3 per lane). (D) RT-qPCR analysis of synchronized U2OS-B6 cells transfected with GFAT1 siRNA (n = 3). (E) RT-qPCR analysis (n = 3) and (F) average real-time bioluminescence (n = 5) of OGT knockdown on clock oscillation in synchronized U2OS-B6 cells. siCTL, scrambled siRNA; siGFAT1, GFAT1 siRNA; siOGT, OGT siRNA. All data are shown as mean ± SEM. *P < 0.05, **P <0.01, ***P < 0.001, ****P <0.0001, post-hoc Bonferroni’s test or two-tailed Student's t test.