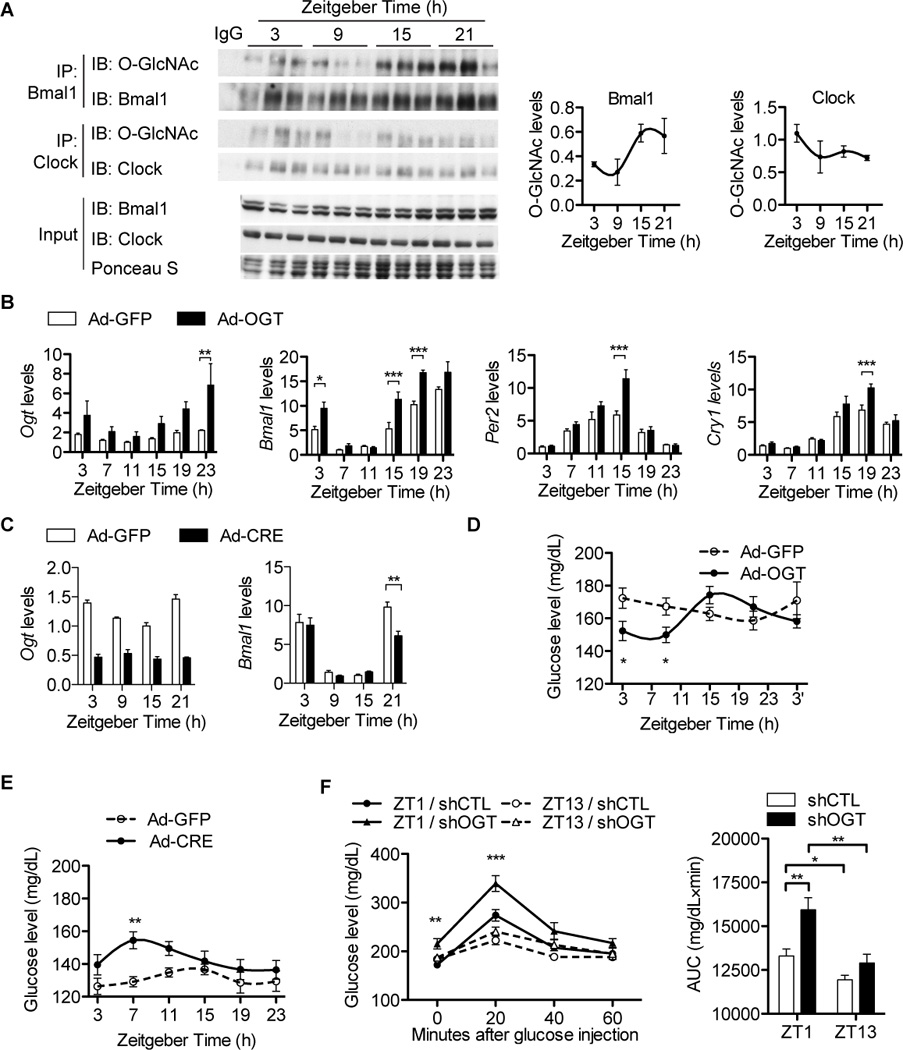
Figure 4. OGT regulates expression of clock genes and glucose homeostasis in mouse livers.

(A) Diurnal O-GlcNAc profiles of BMAL1/CLOCK in mouse livers (n = 3 per time point). Results of densitometry analysis are shown on the right. (B) Diurnal gene expression profiles of male mouse livers transduced with Ad-OGT (n = 4 per time point). Data were normalized to u36b4. (C) Diurnal gene expression profiles of Ogt-floxed female mouse livers transduced with Ad-Cre (n = 3 per time point). Data were normalized to Gapdh. (D) Diurnal plasma glucose levels in male mice overexpressing OGT in livers (n = 7). (E) Diurnal plasma glucose levels in female OGTflox/flox mice overexpressing Cre in livers (n = 12). (F) Diurnal plasma glucose responses to intraperitoneal glucose tolerance tests (GTT) at week 12 in male mice expressing scrambled-shRNA (shCTL) or OGT-shRNA (shOGT) in the liver (n = 7). Average areas under curve (AUC) of GTT curves are shown on the right. All data are shown as mean ± SEM. *P <0.05, **P < 0.01, ***P < 0.001, post-hoc Bonferroni’s multiple comparison test.
