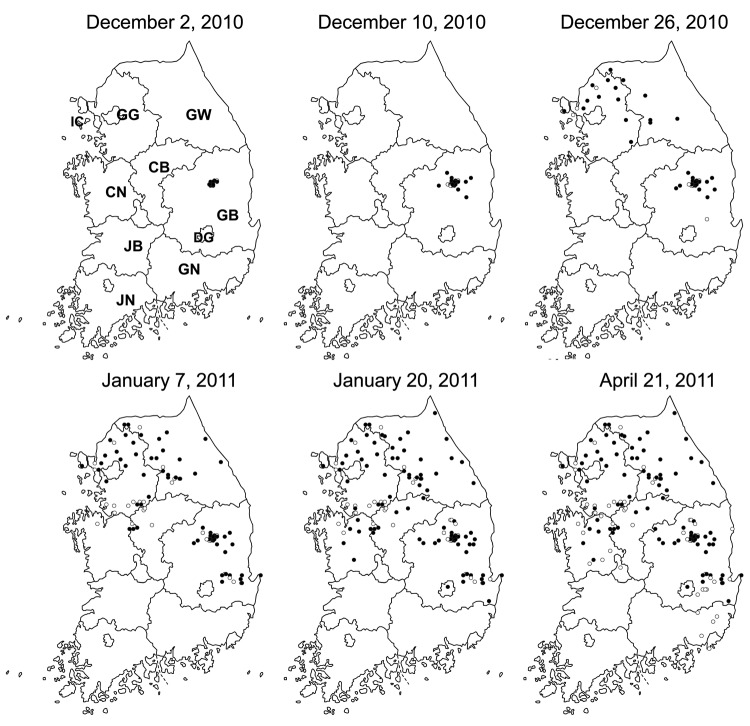
Figure 1.
Progress of foot-and-mouth disease transmission throughout South Korea during 2010–2011 outbreak. Circles indicate cases in swine at index farms; black dots, cases in cattle. A timeline of case detection is provided in online Technical Appendix Figure 1 (wwwnc.cdc.gov/EID/article/19/4/1-1320-Techapp1.pdf). IC, Incheon; GG, Gyeonggi; GW, Gangwon; CN, Chungnam; CB, Chungbuk; GB, Gyeongbuk; GN, Gyeongnam; JN, Jeonnam; JB, Jeonbuk; DG, Daegu.

