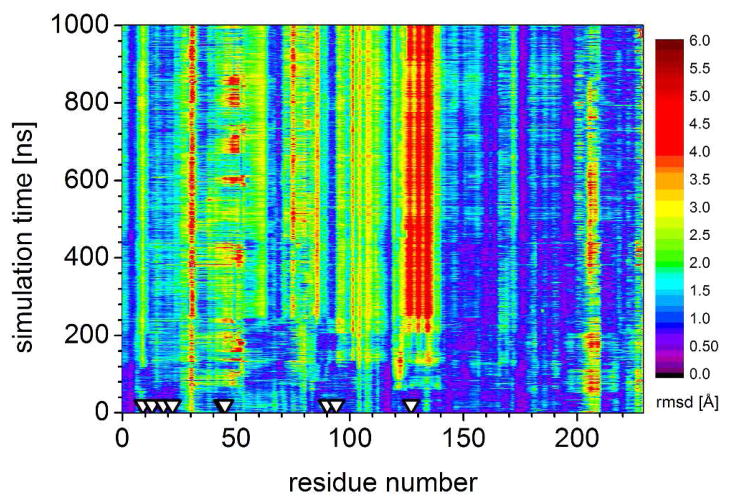
Figure 5.
Backbone RMSD calculated for each residue at 1 ns steps (after fitting all backbone atoms to the original BH32 structure) during a 1 microsecond Anton run of BH32. RMSD is indicated by color, lower in purple/blue and higher in red. The most significant deviations from the design occur in the helix 126–132. Triangles indicate residues 10, 14, 19, 23, 45, 46, 91, 95, and 128, discussed in the text.

