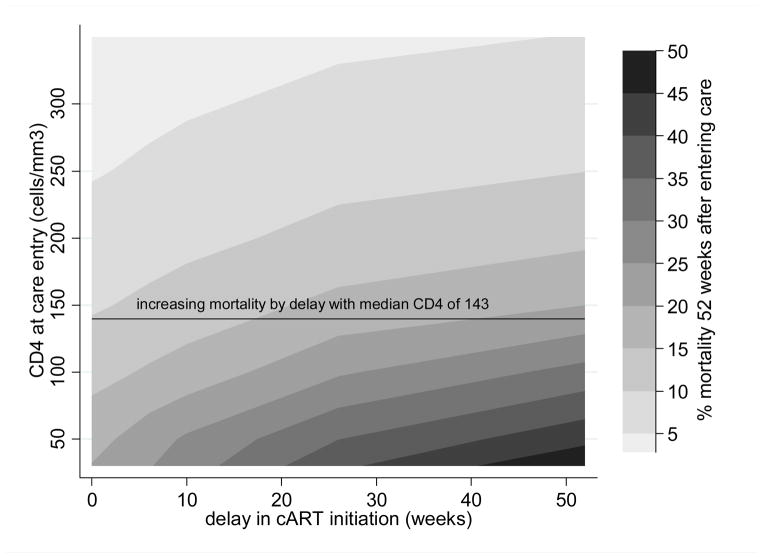
Figure 2.
Contour plot of total mortality risk 52 weeks after entering HIV care by duration of delay in ART initiation (x-axis) and CD4 at care entry (y-axis).
CD4 at the time of entry into care is on the y-axis, delay in ART initiation on the x-axis, and contours represent mortality bands by percent of the cohort who died 52 weeks after entering care. The close contour lines at lower entry CD4 represent the more rapid increase in mortality with delays among such patients. The black line represents the increasing mortality with the whole cohort analysis (median CD4 count 143 cells/mm3) in which mortality increases from 11.0% with no delay to 19.7% with a 26 week delay and 24.2% with a 52 week delay.

