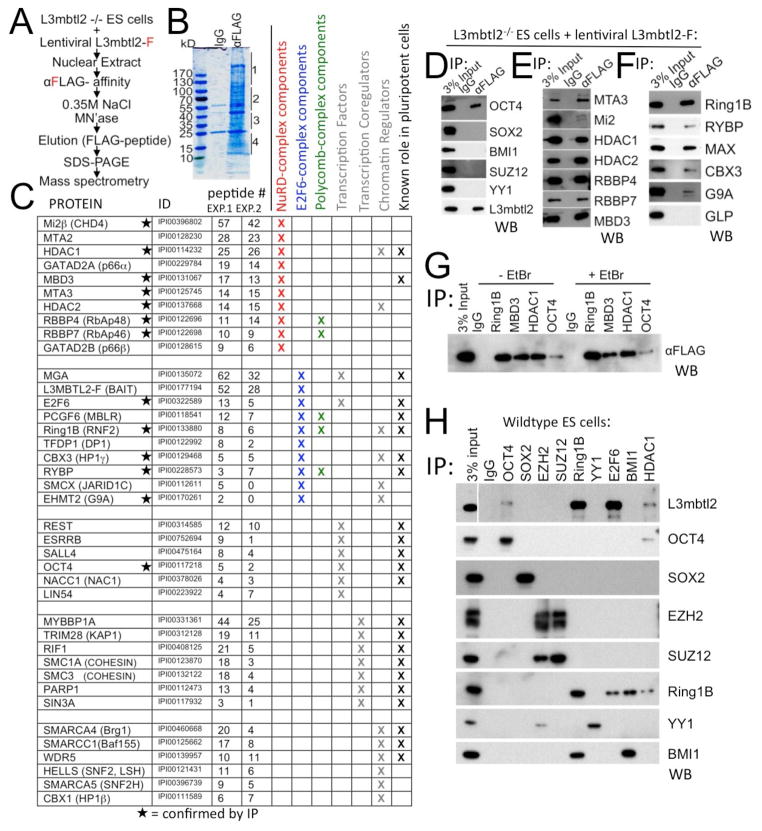
Figure 4. L3mbtl2 physically interacts with components of repressive transcriptional complexes and molecular regulators of ES cell self-renewal and differentiation.
(A–C) Identification of L3mbtl2-associated proteins by mass spectrometry. (A) Scheme of experiment. (B) Proteins isolated by affinity purification revealed by Coomassie Blue stain. Four gel slices per lane (as indicated on by lines, right border) were processed for analysis in each experiment. (C) List of L3mbtl2-F interacting proteins with known roles in transcriptional regulation. Columns indicate name, International Protein Index identifier, number of peptides obtained in two independent experiments, known roles in NuRD complex (red), E2F6-complex (blue), Polycomb-complexes (green), identification as transcription factor, transcription coregulator, chromatin regulator (grey), and known role in ES cell biology (see Suppl. Table S2). (D–H). (D–F) Analysis of selected protein interactions by co-immunoprecipitation (IP) from nuclear extracts of L3mbtl2-F–rescued knockout ES cells followed by Western blot (WB) analysis using antibodies against the indicated proteins. (D) L3mbtl2-F is associated with Oct4, but not Sox2 or Polycomb group proteins Bmi1, Suz12, or YY1. (E, F) Confirmation of L3mbtl2-F’s association with components of the NuRD (E) and E2F6 complexes (F). (G) Reverse Co-IP with antiserum against Ring1B, Mbd3, Hdac1, and Oct4 followed by Western blot analysis with αFLAG (L3mbtl2-F); (G, right) interaction is not diminished in the presence of ethidium bromide (50μg/ml). (H). Immunoprecipitation of candidate interactors followed by Western blot with an antiserum against L3mbtl2 (top), and antisera directed at the immunoprecipitated proteins (bottom 8 panels, IP controls). Note that endogenous L3mbtl2 interacts with Ring1B, E2F6, Oct4 and Hdac1. See Suppl. Fig. S5 for Western blot analysis of expression levels of selected interactors.

