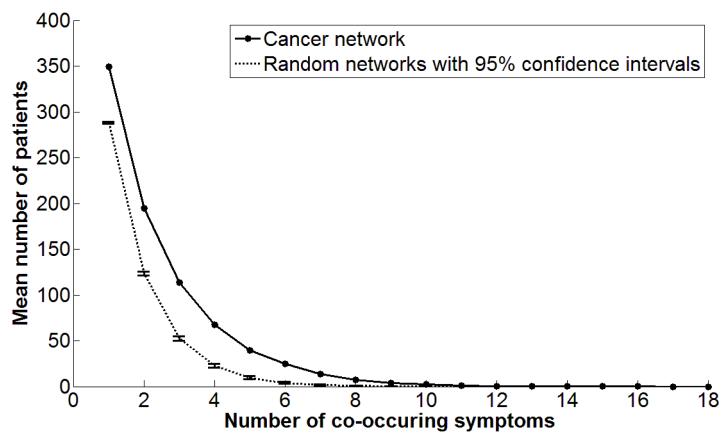
Figure 3.
The mean number of patients who share different numbers of symptoms shows that many patients share between 1-3 symptoms, and a decreasing number of patients share more than 3 symptoms. The area under the curve is significantly different from the same curve generated from 1000 random networks of the same size (shown with 95% confidence intervals).

