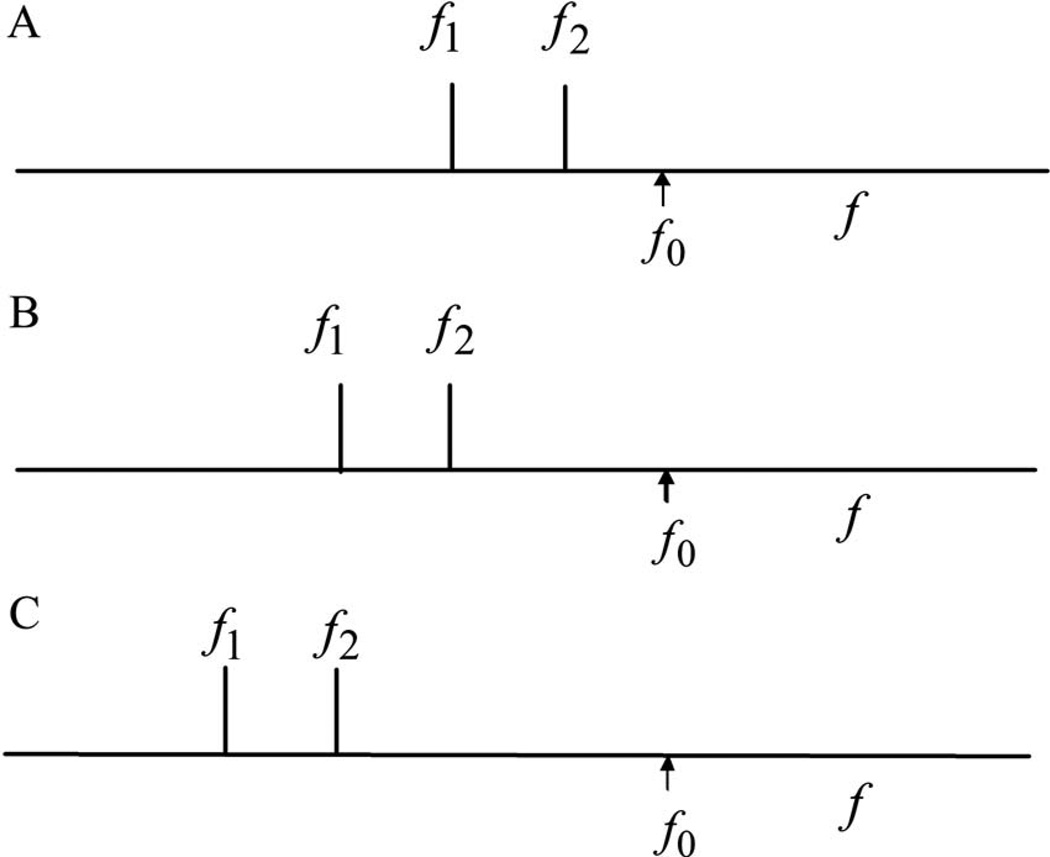
FIG. 2.
Experimental protocol, frequency scale is logarithmic. Frequencies f1 and f2. Frequency ratio R1 equals f2/f1. The frequency f0 is equal to 17 kHz, close to the BF of the observation location. Panel A, istage=1: The higher frequency f2 is equal to f0/R1, the lower frequency f1 is equal to . Panel B, istage=2: Both frequencies are reduced by the factor R1. Panel C, istage=3: Both frequencies are again reduced by the factor R1. For each value of R1 nine of such conditions are used in the experiments.

