
Figure 4. Dependence of the stepping kinetics on the concentrations of ATP and ATP-γ-S.
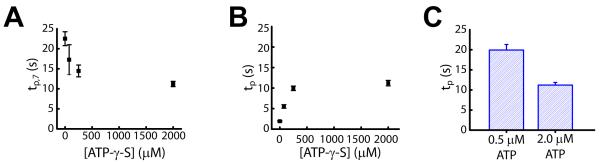
(A) The pause duration after the first, 7-bp compound step (tp,7) at various ATP-γ-S concentrations and 2 μM ATP.
(B) The pause duration between each 1-bp elementary step (tp) at various ATP-γ-S concentrations and 2 μM ATP. All pauses except for the ones after 6, 7, and 8 bp of translocation were pooled to determine tp. As shown in Figure S4, in addition to the 7th pause, the 6th and 8th pauses also appear longer than the remaining ones, likely due to errors in pause identification. The value of tp at 0 μM ATP-γ-S was derived from 1 / k value obtained from the Γ-distribution in Figure 3B.
(C) Dependence of tp on the ATP concentration at 2 mM ATP-γ-S. At this saturating concentration of ATP-γ-S, all pauses, including the 7th one, had approximately equal durations and were pooled to determine tp.
All data are shown as the mean ± SEM (N = 15 - 100 events).
See also Figure S4.