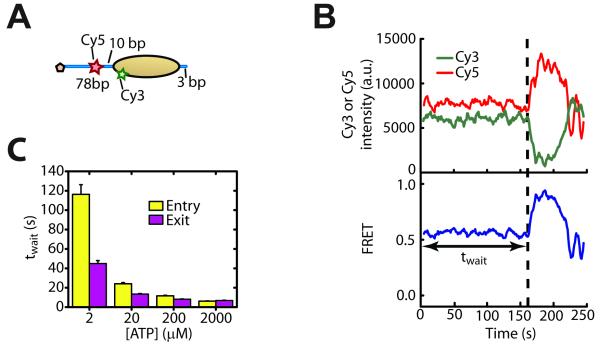
Figure 5. DNA movement on the entry side of the nucleosome precedes that on the exit side.
(A) Schematic of the nucleosome construct used for measuring DNA movement at the entry side.
(B) Donor signal (green), acceptor signal (red), and FRET (blue) time traces showing ISW2-induced remodeling after adding 12 nM ISW2 and 2 μM ATP at time zero. The dashed line indicates the onset of FRET change after an initial wait time, twait.
(C) Comparison of twait on the entry (yellow bars) and exit sides (purple bars) of the nucleosome under identical enzyme and ATP concentrations. Data are shown as the mean ± SEM (N = 80 - 220 events).
See also Figure S5.

