Figure.
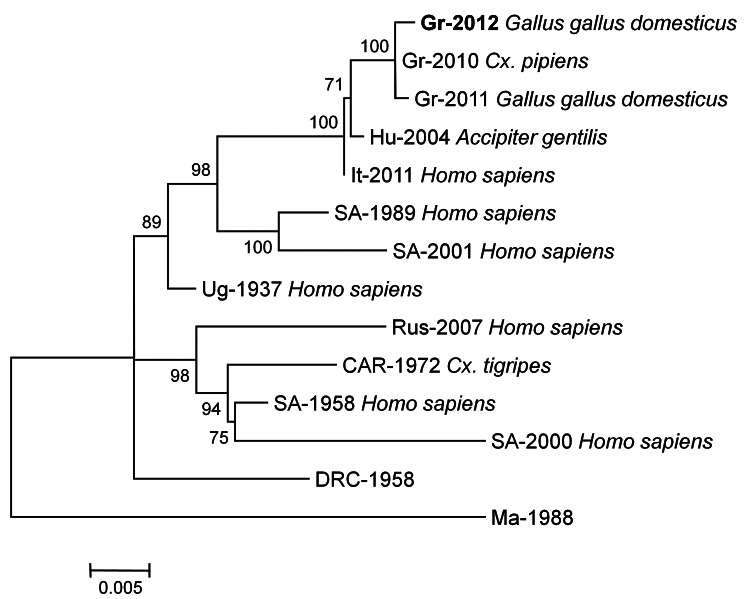
Phylogenetic tree inferred with maximum-likelihood analysis, based on complete nonstructural (NS) 3 nt sequences (1,863 bp) of lineage 2 West Nile virus strains. Isolation source is indicated in boldface. The general time reversible model with gamma distributed rates across sites and a fraction of sites assumed to be invariable (GTR + I + Γ) was selected as the best fitting nucleotide substitution model for the sequence dataset. The tree was mid-point rooted, and the numbers indicated on the branches are nonparametric bootstrap probabilities. Strain abbreviations indicate country, year, and GenBank accession number. Gr-2012: Greece, 2012, JX843471; Gr-2010: Greece, 2010, HQ537483; Gr-2011: Greece, 2011, JN398476; Hu-2004: Hungary, 2004, DQ116961; It-2011: Italy, 2011, JN858070; SA-1989: South Africa, 1989, EF429197; SA-2001: South Africa, 2001, EF429198; Ug-1937: Uganda, 1937, AY532665; Rus-2007: Russia, 2007, FJ425721; CAR-1972: Central African Republic, 1972, DQ318020; SA-1958a: South Africa, 1958, EF429200; SA-2000: South Africa, 2000, EF429199; DRC-1958: Democratic Republic of the Congo, 1958, HM147824; Mad-1988: Madagascar, 1988, HM147823. Scale bar indicates nucleotide substitutions per position. Cx., Culex.

