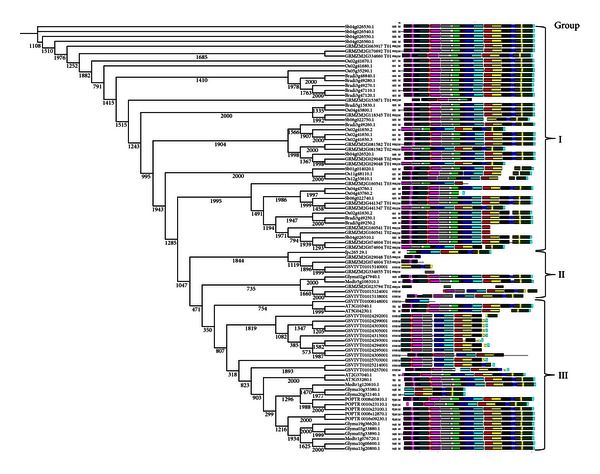
Figure 4.

Schematic diagram of motif distribution of PAL genes. MEME 4.6.0 was applied to show that different subgroups were distinguished by the motif distribution, which is consistent with the phylogenetic subgroups obtained by ClustalX 2.1. Numbers written below each node are bootstrap values derived from 2000 replicates. Twenty conserved novel motifs were shown with different colored boxes.
