
Figure 7.
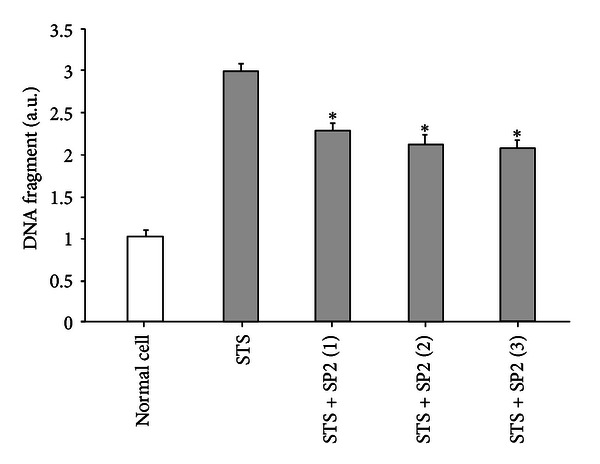
The effects of SP2 on DNA fragmentation caused by STS-induced apoptosis of HUVEC. The vertical axis is the DNA fragment unit; STS is the negative control; STS + SP2 (1–3) are the treatment groups, in which the final concentrations of SP2 sample were 0.5 μg/mL, 1 μg/mL, and 2 μg/mL, respectively. Values are expressed as mean ± SEM (n = 3). *Indicates values significantly different from negative control using Student's t-test; P < 0.05.