
Figure 3.
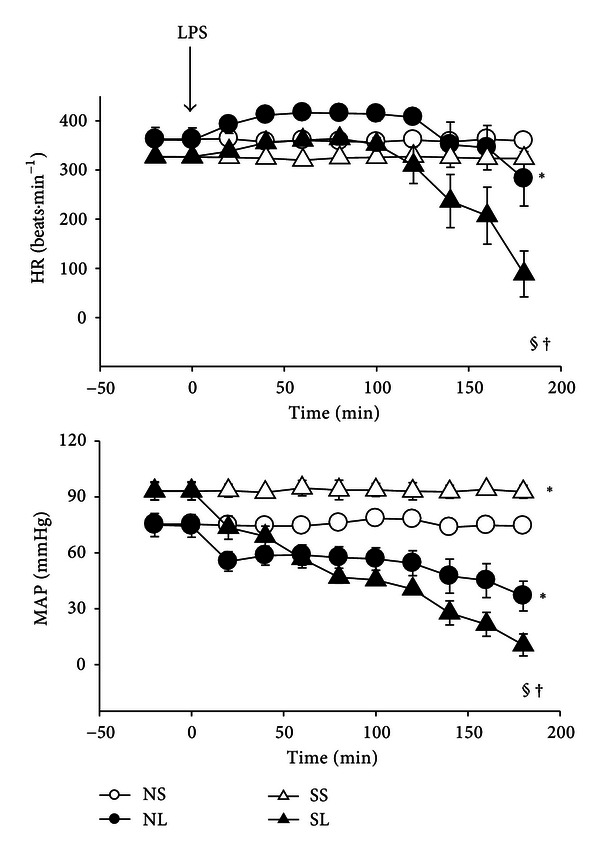
Changes in cardiovascular parameters in normal and diabetic rats during the administration of saline or LPS (15 mg/kg, i.v.). HR: heart rate; MAP: mean arterial pressure. Data are expressed as mean ± S.E.M (n = 8). *P < 0.05, compared with the NS group; § P < 0.05, compared with the SS group; † P < 0.05, compared with the NL group (repeated measures ANOVA).