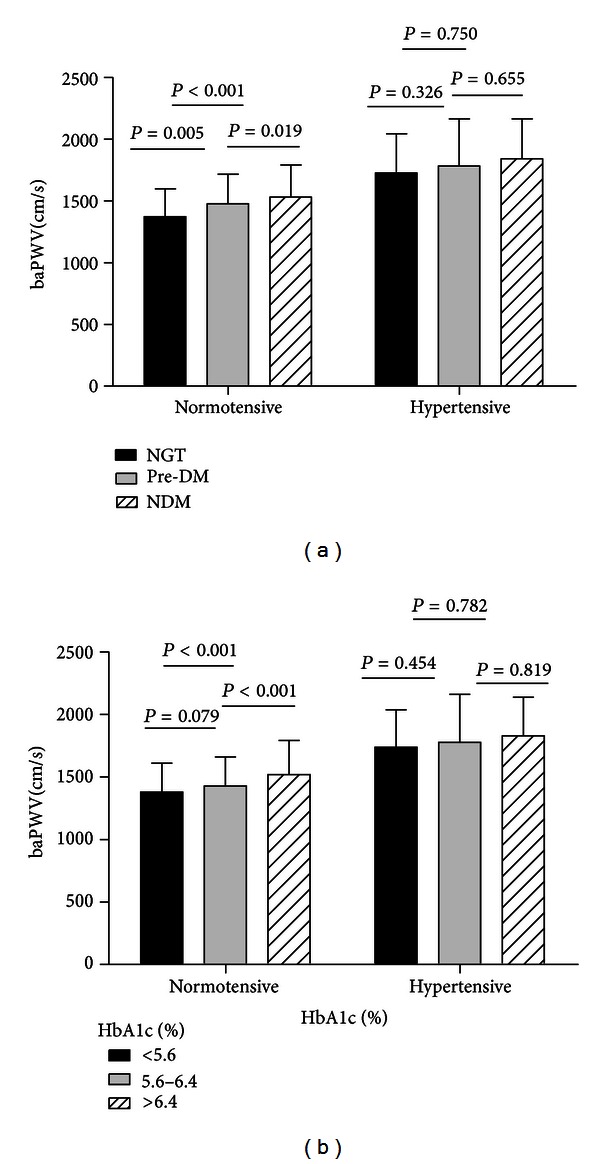
Figure 1.

(a) Difference in PWV values across the glucose tolerance groups, after adjustment for age, gender, BMI, WHR, TG, lipids, HR, and MAP. P for trend = 0.000, 0.429 in normotensive and hypertensive groups, respectively. (b) Difference in PWV values across the HbA1c groups, after adjustment for age, gender, BMI, WHR, TG, lipids, HR, and MAP. P for trend = 0.001, 0.761 in normotensive and hypertensive groups, respectively.
