
Figure 5.
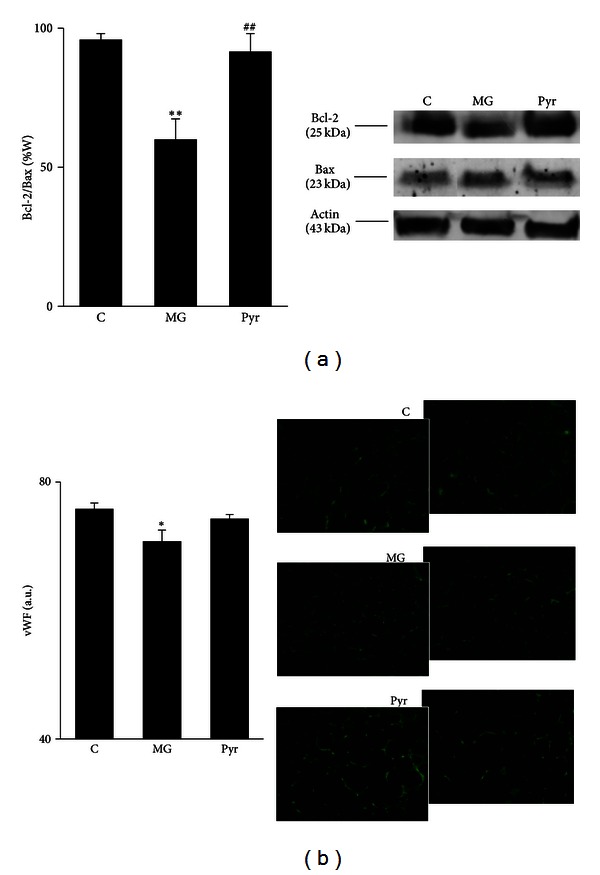
Bcl-2/Bax ratio in adipose tissue: (a) representative Western blots of Bcl-2 and Bax are shown. Immunohistochemistry images show vWF staining, and the respective quantification of fluorescence (b). C: Control Wistar rats; MG: Wistar rats with methylglyoxal administration; Pyr: Wistar rats with methylglyoxal administration and pyridoxamine treatment. n = 6 in each group. *Different from C. #Different from MG. 1 symbol P < 0.05; 2 symbols P < 0.01.