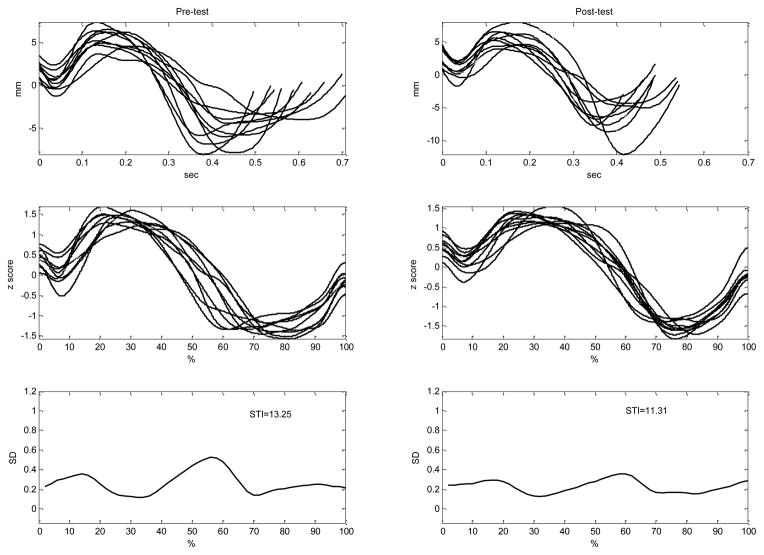
Figure 1.
Example of individual movement records showing time and amplitude normalization and the resulting spatiotemporal index (STI). Data are shown from one participant producing the weak strong (iambic) movement sequences for the novel word /m ə fp ʌ m/. The top panels for each column are the 10 non-normalized movement sequences. The middle panels show the same movement sequences time and amplitude normalized. The bottom panels show standard deviation values obtained at 2% intervals from the normalized records. The STI is the sum of these 50 SDs.

