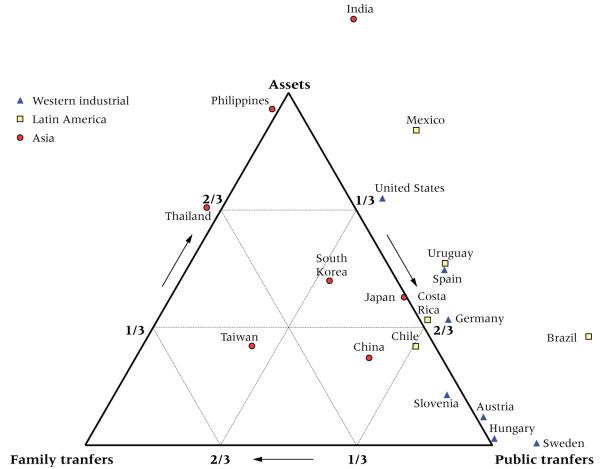
FIGURE 3. Support systems for the elderly 65+ according to NTA data.
NOTE: Countries located at a vertex derive 100 percent of support for old-age consumption from the labeled source at that vertex. Countries along an edge derive support from a mixture of the two sources at its ends. Countries within the triangle derive support from a mixture of the three sources, more from the closer vertexes. In countries outside the triangle, the elderly make net transfers to the opposite source. For example, in Mexico the elderly make net transfers to younger people.

