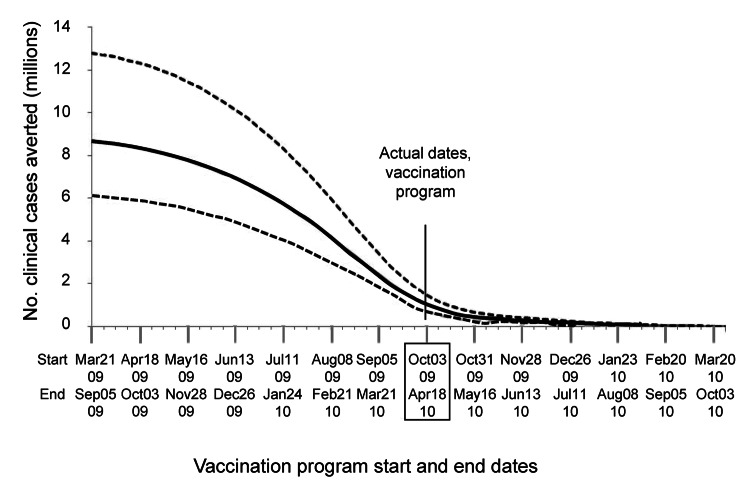
Figure 2.
Comparison of the effects of shifting hypothetical start and end dates on the number of clinical cases prevented by the influenza A(H1N1)pdm09 virus vaccination program in the United States. Doses administered by week and program duration were unchanged from actual program (Table 2). Solid line represents the best estimate; dotted lines represent ranges. October 3, 2009–April 18, 2010, is actual vaccination program period; all other periods are hypothetical. See Table 7 for additional data.

