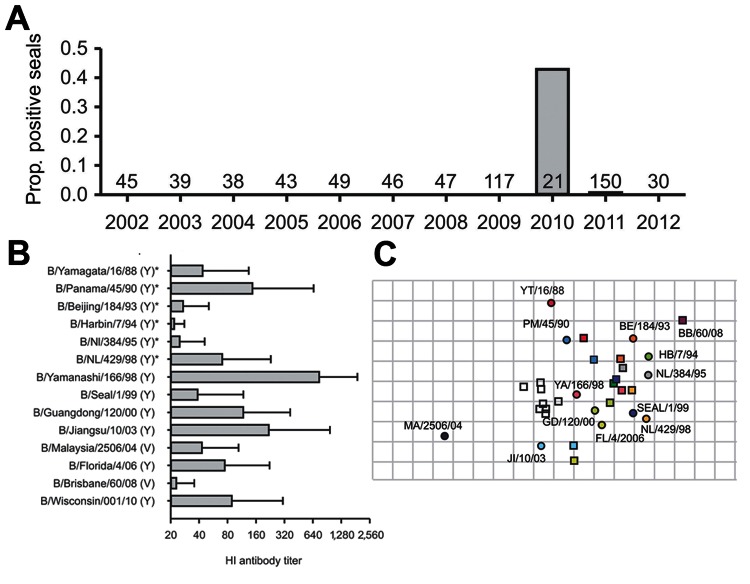
Figure.
Serologic evidence of influenza B virus in seals, the Netherlands, 2002–2012. A) Proportion (prop.) of serum samples for each year shown that were positive for influenza B virus antibodies. The number above the year represents the serum samples tested for that year. B) Mean hemagglutination inhibition (HI) antibody titers (±SD) of tested positive serum samples against different influenza B strains belonging to either the Yamagata (Y) or Victoria lineage (V). Asterisk indicates that only 8 of 10 serum samples were tested against these strains because of the limited amount of serum available from 2 seals. C) Antigenic map of influenza B viruses. Indicated are the relative positions of strains (circles) and ferret antiserum samples (squares). Symbols of strains and homologs of ferret antiserum samples are identical, whereas serum samples of seals are indicated as unfilled squares. The spacing between grid lines is 1 antigenic unit, which corresponds to a 2-fold dilution of antiserum in the hemagglutination inhibition assay. Only serum samples and antigens that were positive against at least 3 influenza B virus antigens or serum samples were included in the antigenic map. YT, Yamagata; PM, Panama; BE, Beijing: BB, Brisbane; HB, Harbin; NL, Netherlands; YA, Yamanashi; GD, Guandong; MA, Malaysia; FL, Florida; JI, Jiangsu

