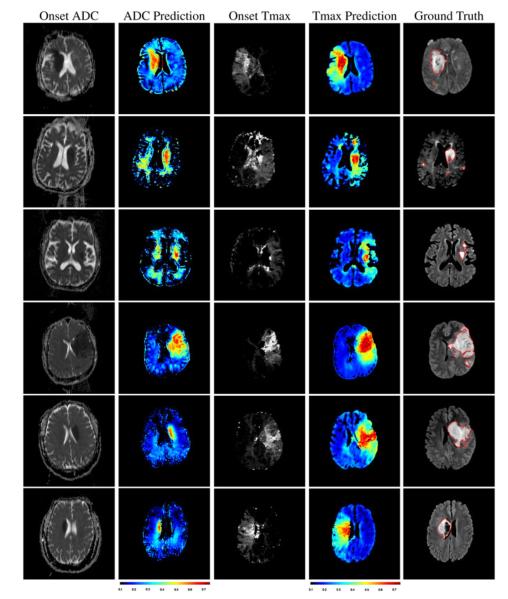
FIGURE 5.
ADC (col. 1) and Tmax perfusion at onset (col. 3) are illustrated with the corresponding prediction of the models (col. 2) and (col. 4) for six patients. During our evaluation, predictions were compared to the ground truth (col. 5, red contours) manually outlined in followup FLAIR at day 4. Regional predictions based on ADC images tend to underestimate the final infarct. Predictions based on Tmax tend to better match the final extent of the infarct.

