
Fig 1.
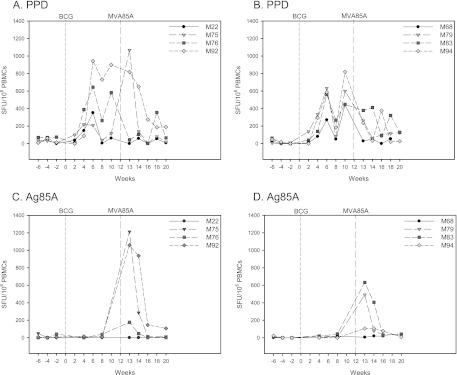
Immune response to vaccination in the peripheral blood. The frequency of vaccine-specific IFN-γ-secreting cells measured by ELISpot following BCG prime with MVA85A intradermal boost in peripheral blood mononuclear cells is shown in the panels on the left, and the panels on the right shows the frequencies following BCG prime with MVA85A aerosol boost. (A and B) Profiles of PPD-specific IFN-γ-secreting cells. (C and D) Profiles of Ag85A-specific IFN-γ-secreting cells. Vaccination with BCG at week 0 is indicated by the dotted line and vaccination with MVA85A indicated by the dashed line at week 12.