
Fig 3.
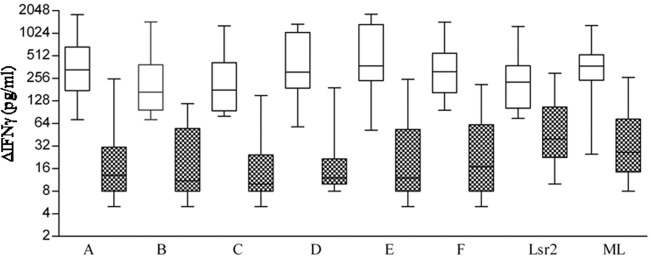
ΔIFN-γ levels in supernatants of antigen-stimulated PBMC cultures from the ENL group of patients as given in the legend to Fig. 1. White boxes indicate values during reaction episodes and patterned boxes values obtained 1 year after reaction episode. Each box-and-whisker plot shows the range (whiskers), interquartile range (box), and median (horizontal line). Significant reductions of IFN-γ were noted at 1 year post-ENL episodes for peptides A, C, D, and E (P < 0.001) and peptide B and M. leprae (P < 0.01, ANOVA with post-Kruskal-Wallis test).