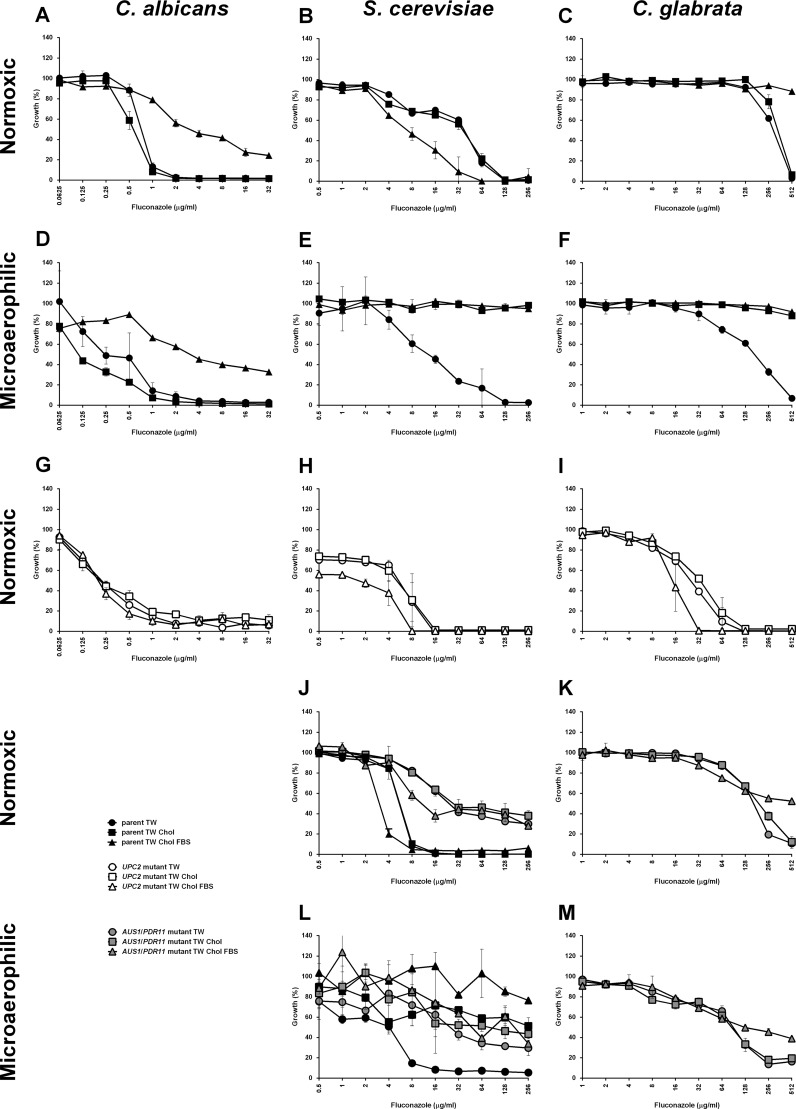
Fig 6.
MICs determined for C. albicans, S. cerevisiae, and C. glabrata. MICs determined under normoxic (A, B, C, G, H, I, J, and K) and microaerophilic (D, E, F, L, and M) conditions for C. albicans (A, D, and G), S. cerevisiae (B, E, H, J, and L), and C. glabrata (C, F, I, K, and M). Parental strains (CaBWP17, ScW303-1a/ScBY4742, and CgKUE200) are represented by black solid symbols, UPC2-null mutants (CaΔupc2/Δupc2, ScΔupc2/Δecm22, and CgΔupc2A/Δupc2B) by open symbols and AUS1/PDR11 mutants (ScΔaus1/Δpdr11 and CgΔaus1) by gray solid symbols. Circles represent medium supplemented with Tween 80, squares represent medium supplemented with Tween 80-cholesterol, and triangles represent medium supplemented with Tween 80-cholesterol-FBS. S. cerevisiae parental strains differ for the UPC2 mutants (W303-1a; graphs B, E, and H) and AUS1/PDR11 mutant (BY4742; graphs J and L) and thus are presented both in separate sections of the figure. Parental strain BY4742 is presented together with its ScΔaus1/Δpdr11 derivative (J and L). Fluconazole concentrations did not exceed 256 μg/ml, with the exception of 2-fold increase for C. glabrata, in order to prevent reaching of critical micelle concentration for this compound. Graphs represent the average of three biological replicates with standard errors.

