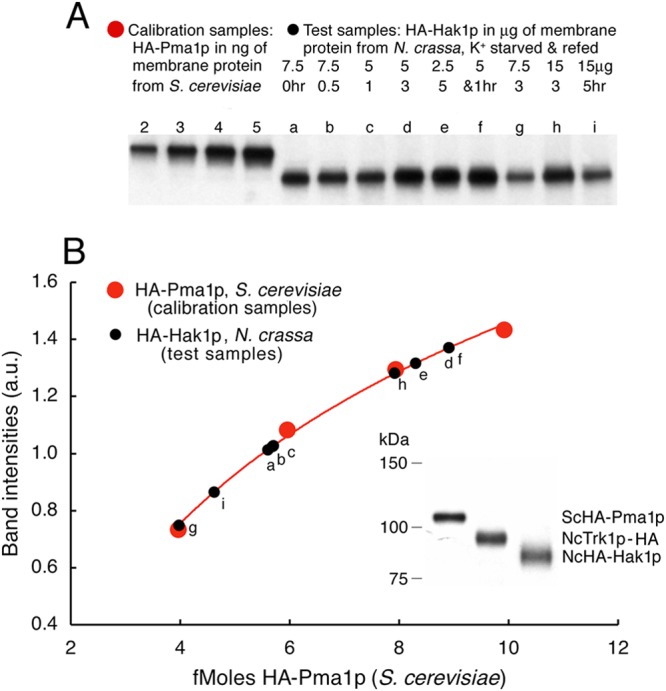
Fig 1.

Quantitative calibration of Western blots using Saccharomyces HA-tagged Pma1p. HA-tagged proteins were electrophoresed on precast polyacrylamide gradients blotted onto PVDF membranes, blocked with milk, stained first with anti-HA monoclonal antibody and then with anti-mouse antibody, and visualized by means of ECL reagent (see Materials and Methods). Each gel was run with four lanes containing ScPma1p N terminally tagged with the HA epitope (red circles) and 2, 3, 4, and 5 ng of membrane protein at 20% purity (A. B. Mason and K.E. Allen, unpublished data), representing 4, 6, 8, and 10 fmol of HA, respectively, attached to Pma1p. The test Neurospora membrane preparations contained 2.5 to 15 μg of membrane protein (black circles), including HA-tagged Hak1p. (A) Blots showing the four calibrating loads of Saccharomyces membrane protein and several test loads of Neurospora membrane protein. Samples of Neurospora were starved of K+ for 0.5 to 5 h and then refed 10 mM K+ for 1 to 5 h. (B) Plotted points indicate digitization of the bands shown in panel A. The smooth curve indicates the least-square fit of a simple log function to the calibrating points (red). Test points (black) are plotted as per-band intensity (ordinate) and are measured in fmol (abscissa). (Inset, lower right) Single blot comparing Saccharomyces HA-Pma1p to the two Neurospora proteins of interest here.
