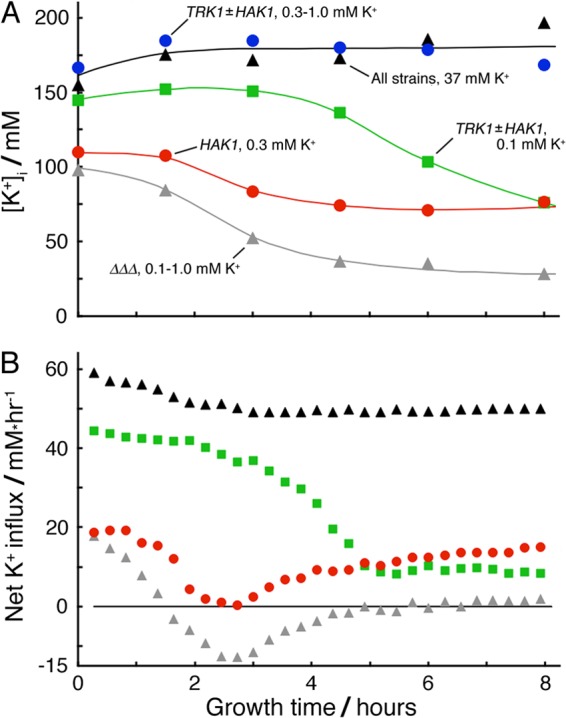
Fig 8.

Time courses of intracellular K+ concentration and net flux during exponential growth of Neurospora on limiting potassium. The experiment and measurements were the same as those described for Fig. 3. (A) Cell-associated potassium measured and [K+]i calculated as described in Materials and Methods. Smoothed curves were drawn by hand. Different starting values of [K+]i reflect net loss of cellular potassium during the lag phase (−4 to 0 h). Scatter of measured [K+]i values (±1 SD) was ∼20% of the mean value. (B) Implied net fluxes were calculated from the increment of total cellular potassium over each successive 16-min interval along the appropriate smooth curve in panel A and then divided by the average cell mass during the same interval along the corresponding fitted curve in Fig. 3. Positive values represent net influx.
