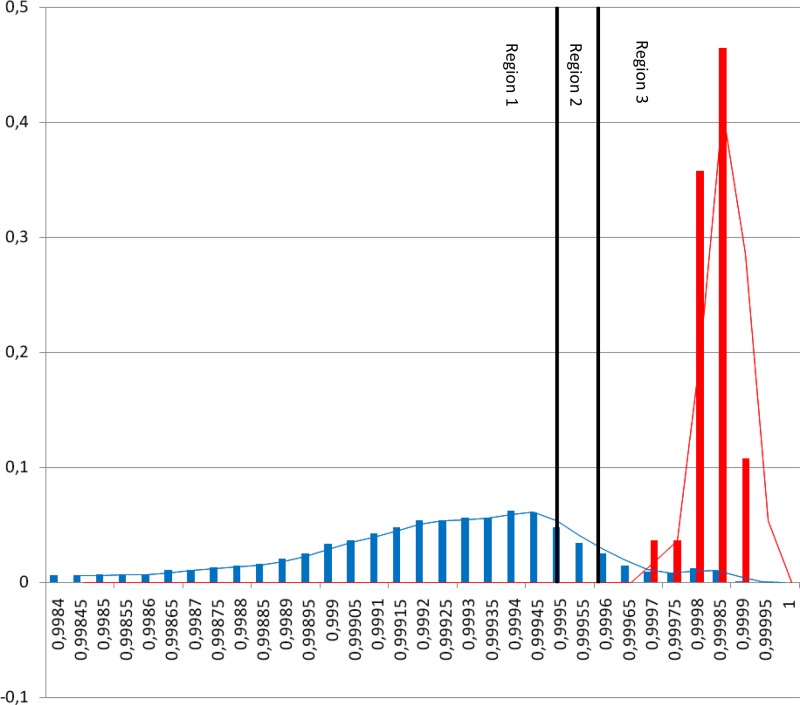
Fig 1.
Histogram of r2 values found for our study. The r2 values between replicates are indicated by red bars; r2 values between isolates are indicated by blue bars. Region 1 indicates nonrelated isolates in the SCRA analysis. When the isolates are in region 3, these isolates are indistinguishable in the SCRA analysis. Isolates in between these regions (in region 2) are possibly related. The cutoff is chosen in region 2, based on the presumption that ≥95% of all replicates must have an r2 value above this cutoff. This similarity cutoff is set to 0.9996.

