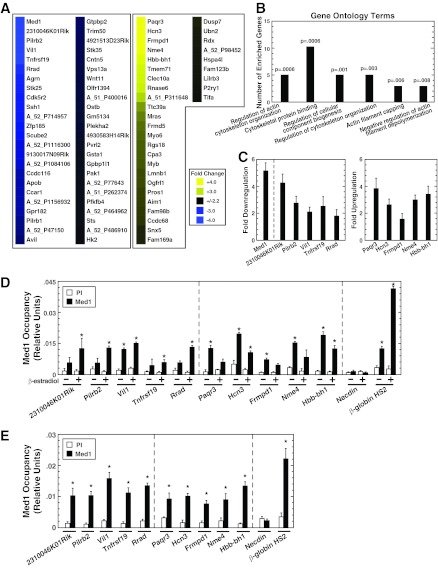
Fig 1.
Med1 regulates a novel gene ensemble in erythroid cells. (A) Heat map of genes up- or downregulated ≥2.2-fold by Med1. Results are mean fold changes calculated from normalized signals from three Agilent 4×44K mouse whole-genome arrays hybridized to aRNAs isolated (in three independent experiments) from control and Med1-knockdown G1E-ER-GATA-1 cells induced to undergo erythroid maturation with β-estradiol. (B) Major Gene Ontology terms that are significantly overrepresented in the Med1 target gene cohort. GO term categories are presented in order of statistical significance along the x axis, while the number of enriched genes per category is shown along the y axis (56). (C) qRT-PCR validation of Med1 target genes. Levels of mRNA in G1E-ER-GATA-1 cells treated with 240 pmol control or Med1 siRNA for 48 h and 1 μM β-estradiol for 24 h were quantified. Results are means ± standard errors for six independent experiments. (D) Quantitative ChIP analysis of Med1 occupancy at Med1-regulated genes in G1E-ER-GATA-1 cells either left untreated or treated with 1 μM β-estradiol for 24 h. Results are means ± standard errors for three independent experiments. (E) Quantitative ChIP analysis of Med1 occupancy at Med1-regulated genes in Ter119+ primary mouse bone marrow cells. Results are means ± standard errors for three technical replicates.

