
Fig 6.
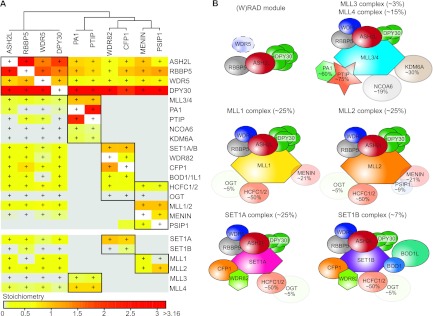
SET1/MLL interactome. (A) Hierarchical clustering of overlapping interactors identified for Wdr5, Rbbp5, Ash2L, and Dpy30 pulldowns. Bait proteins are indicated on top and identified interactors on the right. Coloring (ascending from gray to red via yellow and orange) is based on the stoichiometry of the interactor in that pulldown, relative to the total amount of Set1a/b and Mll1 to Mll4 proteins found for that bait. Significant outliers are indicated (+) for each bait protein. (B) Summary of the composition and relative amounts of the SET1/MLL complexes determined in this study. Dpy30 is present as a multimer dependent on the complex context. Proteins that have a stoichiometry of <1 are displayed as transparent, and their relative abundance is indicated.