
Fig 4.
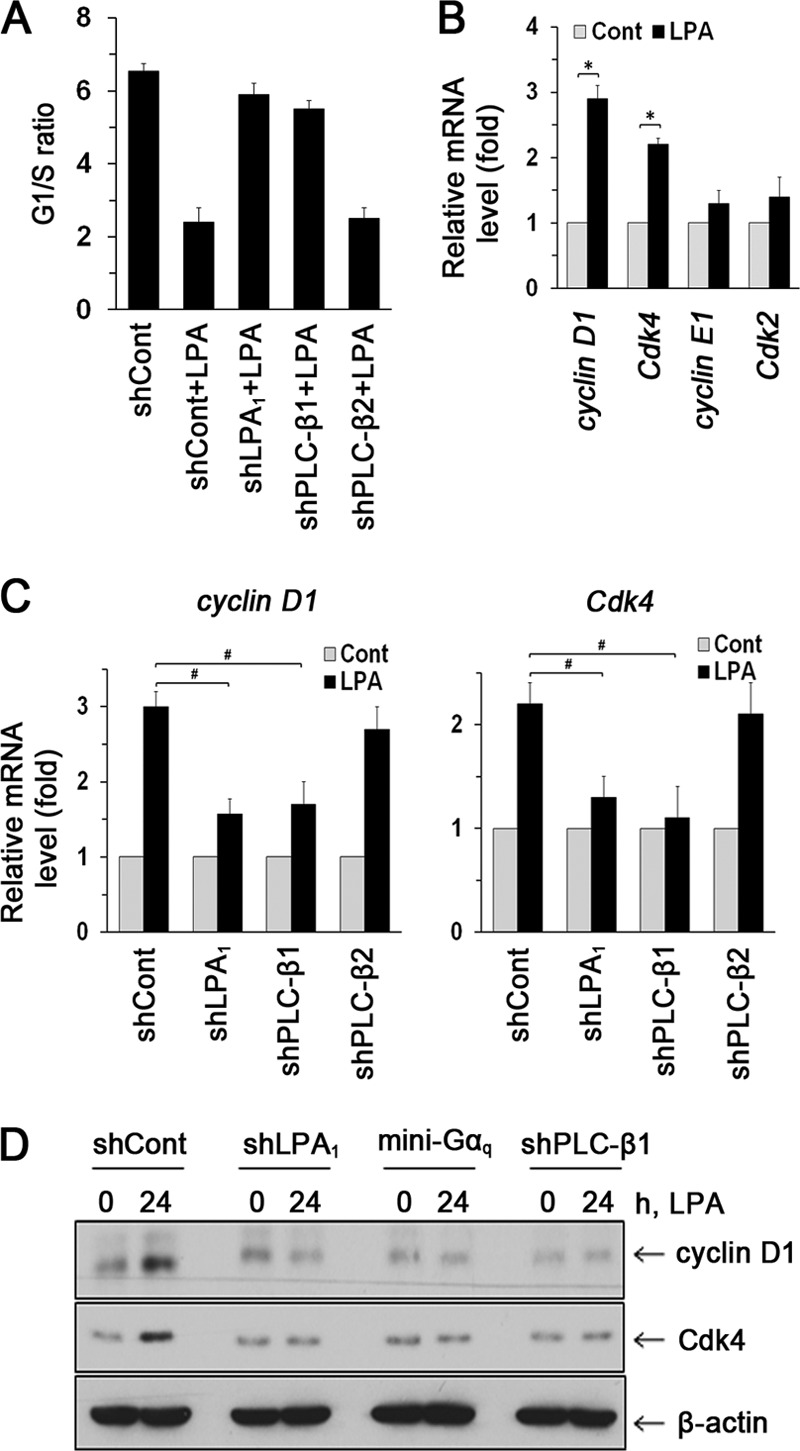
LPA1 regulates cell cycle progression. (A) G1/S ratios in cells treated with LPA are shown. n = 3. (B) Expression levels of cyclin D1, Cdk4, cyclin E1, and Cdk2 were determined by real-time RT-PCR. n = 3. *, P < 0.01. (C) Expression levels of cyclin D1 and Cdk4 mRNA are shown. n = 3. #, P < 0.01. (D) Expression levels of cyclin D1 and Cdk4 were determined by Western blotting. Representative blots from three independent experiments are shown.