
Fig 7.
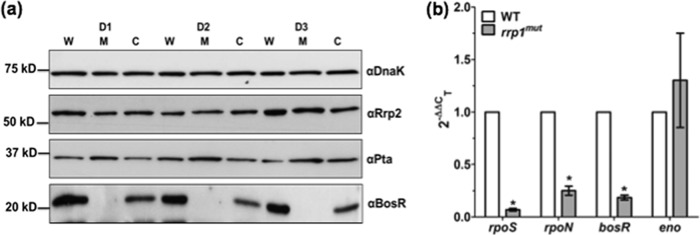
Rrp1 regulates RpoS expression through BosR. (a) Detection of BosR, Pta, and Rrp2 via immunoblot analyses was performed as described for Fig. 6. (b) qRT-PCR analysis of bosR, rpoN, rpoS, and eno transcripts was performed as described for Fig. 4a. Data are expressed as expression of the rrp1mut transcripts relative to that of the corresponding wild-type transcripts. Asterisks indicate that the differences between WT and rrp1mut transcript levels were statistically significant at a P value of <0.01 (two-way ANOVA).