Fig 3.
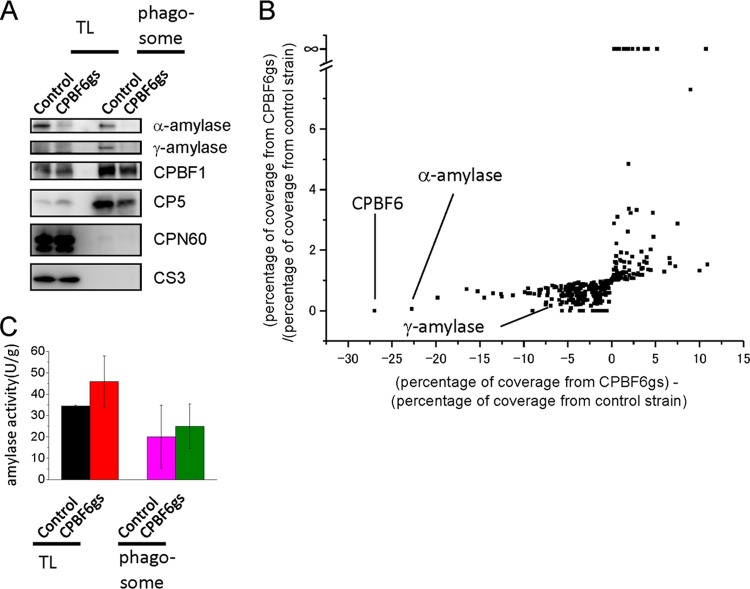
Phenotypic changes of CPBF6 gene silencing. (A) Immunoblot analysis of the whole-cell lysate and the phagosome fraction. Approximately 20 μg of the whole-cell lysate and 2 μg of the phagosome fraction were electrophoresed by SDS-PAGE and subjected to immunoblot analysis using anti-α-amylase, anti-γ-amylase, CPBF1, CP5, Cpn60, and CS3 antibodies. CPBF1 and CP5 are phagosomal proteins, while CPN60 is a mitosomal marker and CS3 is a cytosolic marker. Faint smeary bands in the whole-cell lysate of the control and CPBF6gs strains, detected with anti-γ-amylase antibody, were considered background because of their low intensities compared to those in the phagosome fraction. (B) Proteomic analysis of isolated phagosomes from CPBF6gs and control strains. Each dot represents a protein identified from phagosomes. The x axis indicates the percentage of coverage from CPBF6gs minus the percentage of coverage from the control strain), and it is theoretically close to 0 when the repression of CPBF6 does not affect the trafficking of a protein. Similarly, y axis indicates the percentage of coverage from CPBF6gs divided by the percentage of coverage from the control strain, and it is close to 1 when the repression of CPBF6 does not affect the trafficking of a protein. Individual data are shown in Table S2 in the supplemental material. (C) Enzymatic activities of amylase in whole-cell lysates and phagosomes from CPBF6gs and control strains. The amoeba lysate, culture supernatant, or phagosomal fraction was mixed with 200 μg/ml of substrate solution containing BODIPY FL-conjugated DQ starch in 100 μl of 0.1 M MOPS (pH 6.9). The fluorescence was measured at excitation and emission wavelengths of 485 and 530 nm, respectively, at 25°C for 60 min. Data shown are the means ± standard deviations of three independent experiments.

