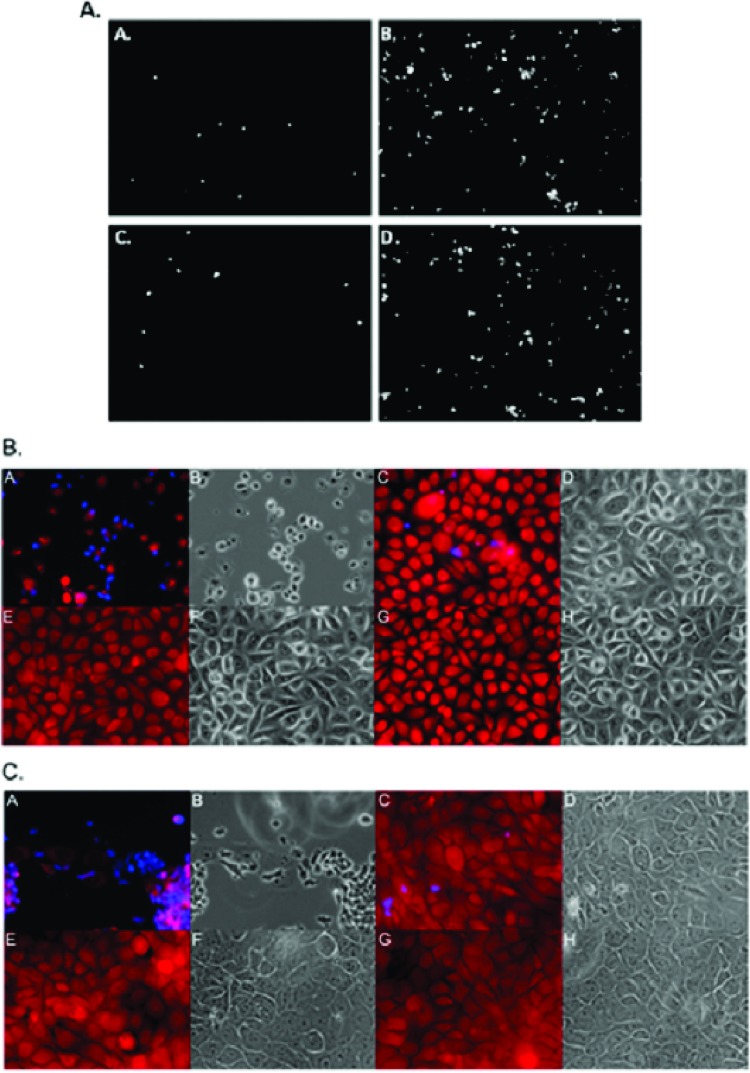
Fig 1.
Visualization of T. vaginalis adherence to and cytolysis of human ectocervical (Ect1) or benign hyperplasia prostate (BHP-1) cell monolayers. (A) Representative adherence fields of T. vaginalis strain T1 (panels A and C) or MSA1132 (panels B and D) parasites labeled with Cell Tracker Blue to monolayers of Ect1 (panels A and B) and BPH-1 (panels C and D) cells. Images were captured with a 10× objective. (B) Cell Tracker Blue-labeled MSA1132 (panels A, B, E, and F) or T1 (panels C, D, G, and H) parasites were exposed to Cell Tracker Red-labeled Ect1 monolayers (panels A to H) either directly (panels A to D) or with a 0.4-μm porous membrane barrier between them (panels E to H) for 4 h. (C) Cell Tracker Blue-labeled MSA1132 (panels A, B, E, and F) or T1 (panels C, D, G, and H) parasites were exposed to Cell Tracker Red-labeled BPH-1 (panels A to H) monolayers either directly (panels A to D) or with a 0.4-μm porous membrane barrier between them (panels E to H) for 4 h. All fluorescent images are of the red (epithelial cells) and blue (parasites) images merged; all the phase panels are the same field as the fluorescent image to the left. All images were taken with a 40× objective.

