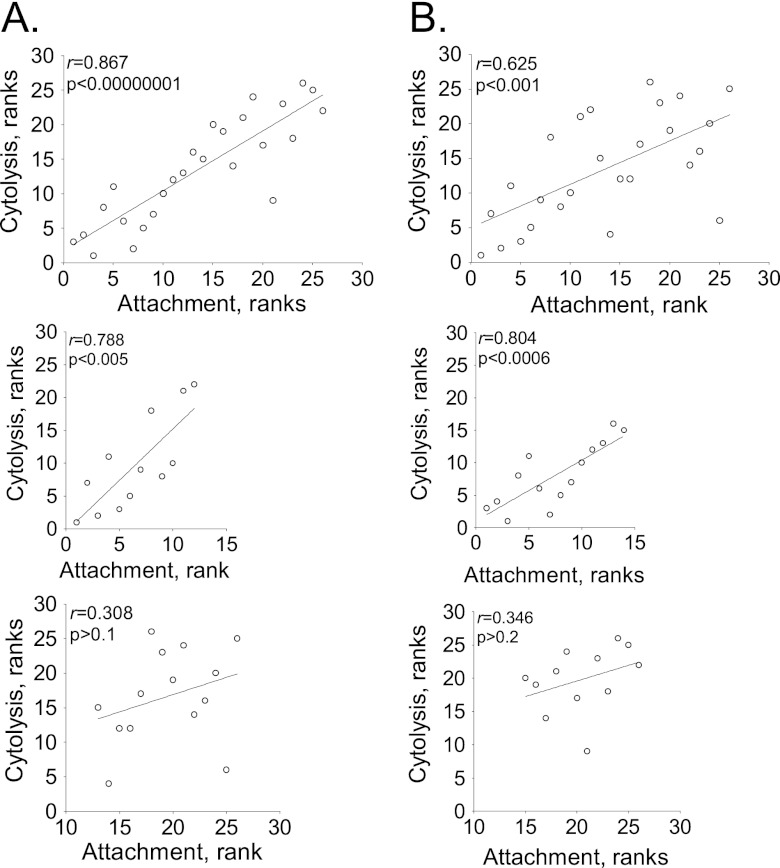
Fig 3.
Correlation of attachment and cytolysis. The T. vaginalis strains were ordered according to increasing attachment and independently for increasing cytolysis, and ranked values were plotted for Ect-1 (A) and BHP-1 (B). The top scatter plot shows all strains assayed. Strains with low and high adherence were independently examined in the middle and bottom scatter plots, respectively. Lines are the best-fit trendlines. The Pearson coefficient (r) and the significance value (p) are on the upper left of each plot.

