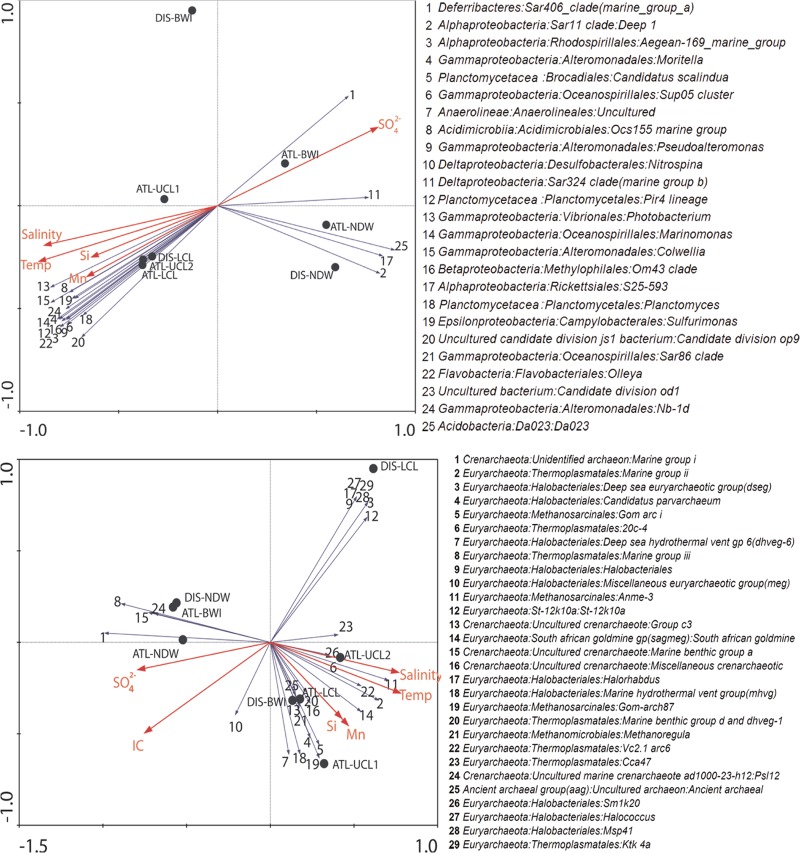
Fig 4.
RDA ordination plots showing relationship between statistically significant environmental factors with bacterial (top) and archaeal (bottom) communities. The numbers correspond to the genera in the keys at right and are ranked according to abundance. Environmental parameters were selected in a parsimonious manner using a DCA preassessment analysis whereby parameters are added in order of highest variation explained to saturation. Bacterial and archaeal genera were selected against an abundance threshold of 0.01% in at least one sample.

