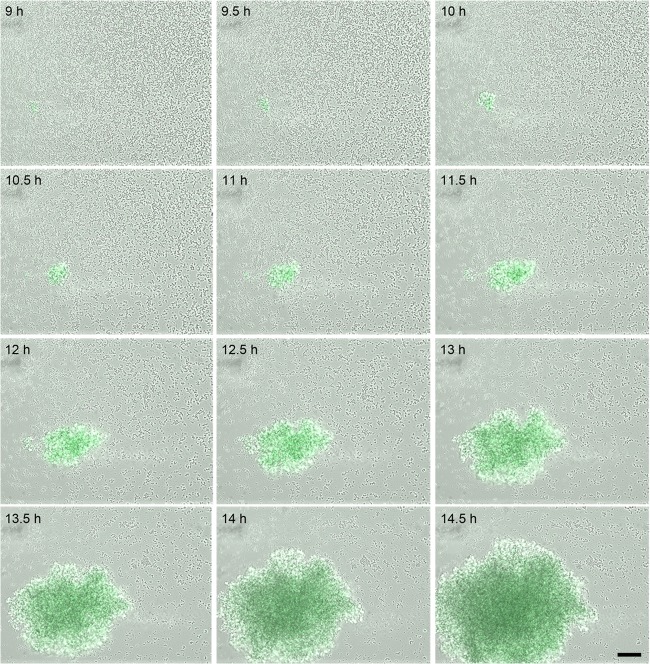
Fig 5.
Temporal analysis of lrgAB expression during biofilm development. S. aureus cells containing the lrg::gfp reporter plasmid were inoculated into a BioFlux microfluidic system and allowed to form a biofilm within a flow shear environment at a flow rate of 64 μl/h for a total of 18 h. Bright-field and epifluorescence microscopic images were collected at 5-min intervals at ×200 magnification. The images presented were taken from the complete set of 217 images spanning 9 to 14.5 h and illustrate typical tower development and GFP expression observed in multiple experiments. See Video S3 in the supplemental material for a video compilation of these images. The scale bar represents 50 μm.

