
Fig 7.
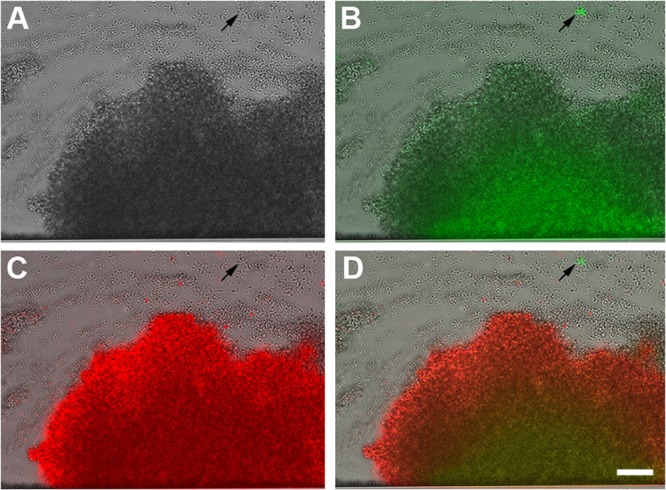
Differential expression of cid and lrg within different towers. The individual images collected at 17 h from Fig. 6 are presented to better illustrate the green and red fluorescence produced by the S. aureus cid::gfp lrg::sDsRed dual-reporter strain (at ×200 magnification). The panels include images collected by bright-field microscopy only (A), a bright-field microscopy and FITC overlay (B), a bright-field microscopy and TRITC overlay (C), and a bright-field microscopy, FITC, and TRITC overlay (D). The scale bar represents 50 μm. The arrows indicate the small, highly fluorescent cid-expressing towers.