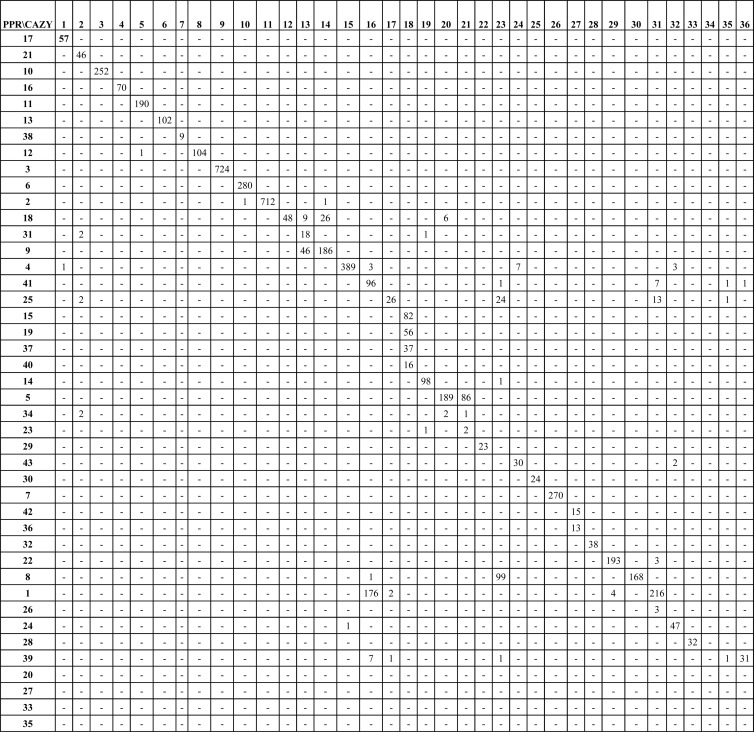
Fig 3.
Correlation between PPR subfamilies and CAZy subfamilies of 5,457 GH13 proteins. Shown is a cross comparison of the proteins in the PPR subfamilies with the same proteins in CAZy subfamilies. The PPR subfamilies were arranged to give the highest number of shared proteins between subfamilies along the diagonal of the diagram.

