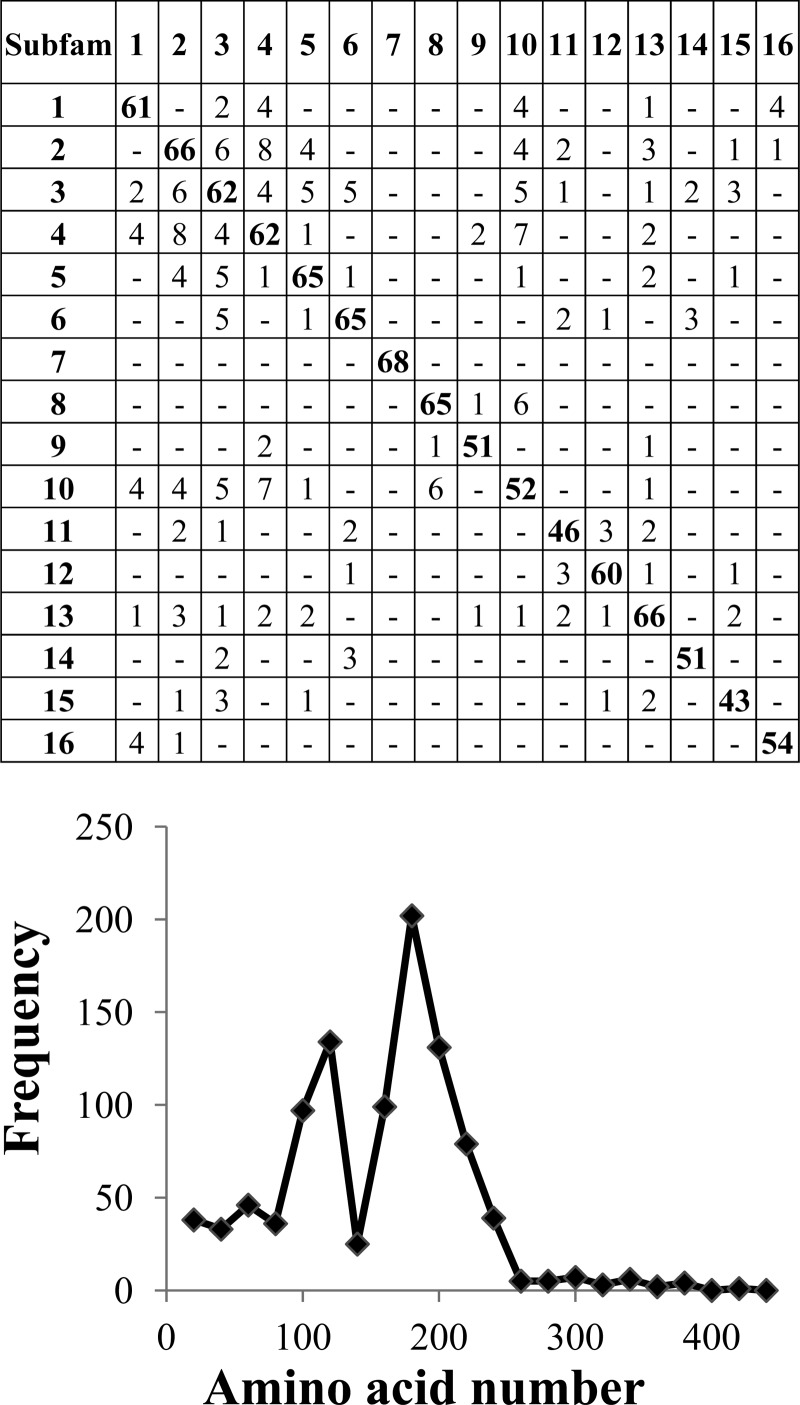
Fig 4.
Cross comparison and distribution of the conserved hexapeptides in the GH61 sequences. The distribution of hexapeptides for each subfamily was calculated as the number of hexapeptides mapping to each 20-amino-acid interval, as described in Materials and Methods. The accumulated hexapeptide frequency (vertical axis) was calculated as the sum of the distribution of all the subfamilies in each 20-amino-acid interval. The horizontal axis designates the amino acid intervals.

