Fig 5.

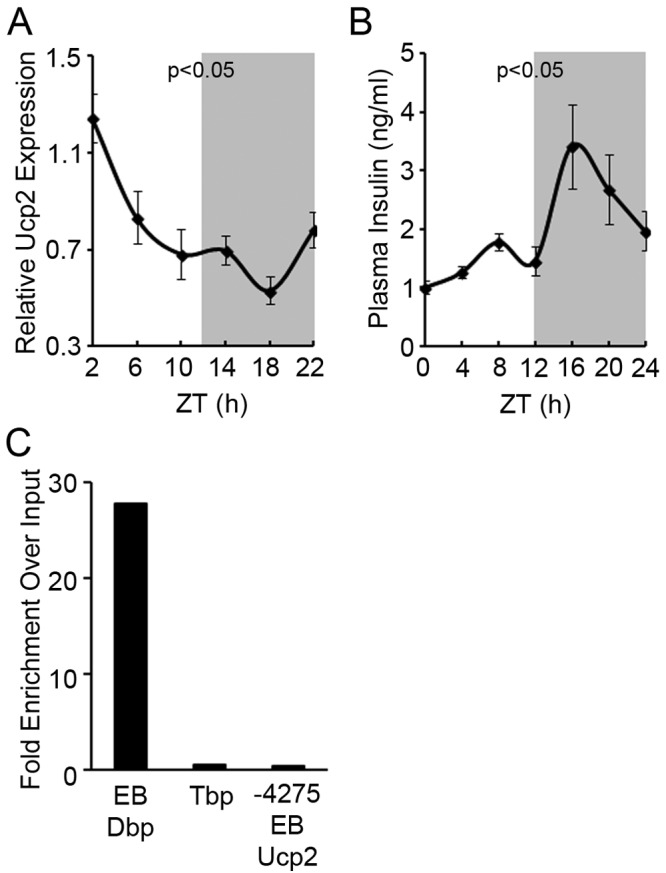
Ucp2 expression is circadian. (A) RT-qPCR of Ucp2 from total RNA from islets isolated every 4 h from wild-type control mice housed in normal 12-h light-dark (LD) cycles. Light on at 6 am was ZT0. All values are means ± the standard errors of the means. P ≤ 0.05 by one-way repeated-measures ANOVA for the various time points. (B) Plasma insulin measured every 4 h from wild-type control mice housed in normal 12-h LD cycles. Light on at 6 am was ZT0. All values are means ± the standard errors of the means. P ≤ 0.05 by one-way repeated-measures ANOVA for the various time points. (C) ChIP of 832/13 cells with anti-Bmal1 antibody and qPCR with primers flanking putative Bmal1 binding E-box elements (EB). DNA binding protein (Dbp) and Tbp are positive and negative controls for Bmal1 target genes. The y axis represents the ratio of pulldown DNA to input DNA expressed as the fold change over the IgG control.
