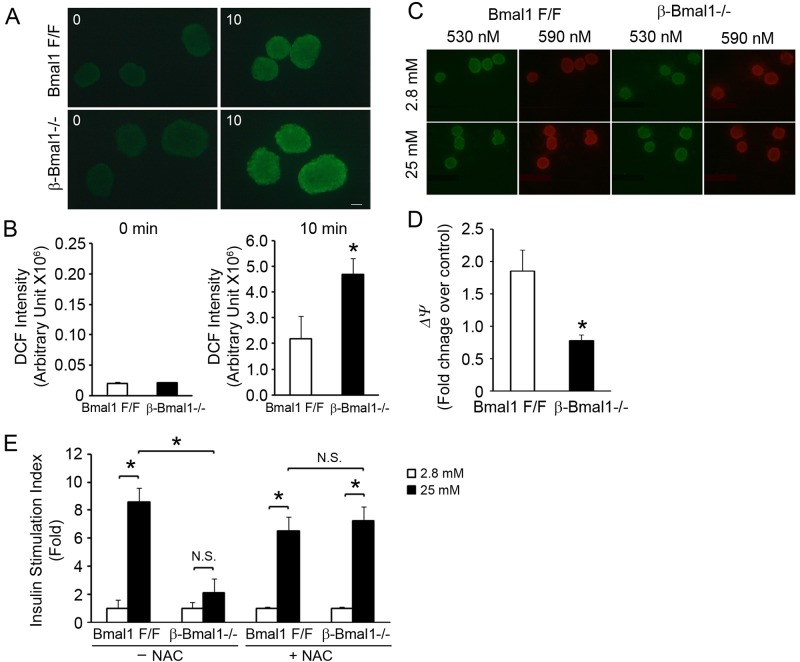
Fig 6.
Increased ROS seen in β-Bmal1−/− islets leads to impaired GSIS. (A and B) ROS measured by DCF fluorescence after exposure to 11.1 mM glucose for 10 min. Representative images of DCF fluorescence are shown in panel A, and the quantitation is shown in panel B. n = 4. The scale bar represents 20 μm. (C and D) Red/green (590/530) fluorescence of isolated islets after loading with JC-1 dye on exposure to 2.8 and 25 mM glucose concentrations. Representative images of the JC-1 assay are shown in panel C. The images shown were taken at emission wavelengths of 530 nm (green indicates the cytosolic JC-1 dye) and 590 nm (red indicates the intramitochondrial dye). Red/green (590/530) fluorescence ratios were quantitated, and the values shown are old changes over Bmal1F/F islets in 2.8 mM glucose (D). n = 4. (E) GSIS in isolated islets from β-Bmal1−/− and control Bmal1F/F mice with or without preincubation with 1 mM NAC for 1 h, as indicated. All values are expressed as fold changes over the basal level of insulin secretion of Bmal1F/F islets in 2.8 mM glucose. n = 4. All values are means ± the standard errors of the means. *, P ≤ 0.05; N.S., not significant.

