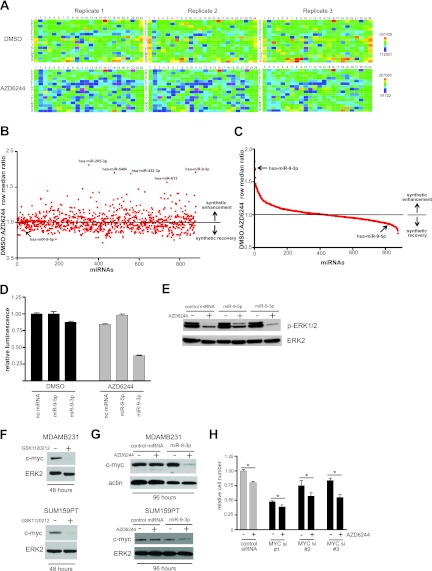
Fig 1.
miR-9-3p is a synthetic enhancer of MEK inhibition in MDA-MB-231 cells. (A) Heat maps (MARS software; BMG LabTech) depicting the reproducibility between triplicate microplates of the primary screen for one daughter plate of a Dharmacon human miRIDIAN microRNA mimic library. Color bar scales for replicate DMSO- and AZD6244-treated plates represent raw luminescence counts from the CellTiter-Glo (Promega) growth inhibition/viability assay, dependent on cellular ATP concentration. (B) Scatter plot showing the distribution of primary synthetic enhancer screen. DMSO/AZD6244 row median ratios of >1.0 indicate synthetic enhancement, while ratios of <1.0 represent synthetic recovery. The five highest-ranking synthetic enhancer miRNA mimics are indicated, and the screen position of miR-9-5p (arrow) is shown to contrast its opposing effect on cell proliferation compared to that of its counterpart strand, miR-9-3p. (C) Distribution of the primary screen plotted as a spectrum of decreasing synthetic enhancement to increasing synthetic growth rescue. The rankings of miR-9-3p and miR-9-5p are indicated by arrows. (D) CellTiter-Glo assay from the primary screen showing miR-9-3p/AZD6244 synthetic enhancement and the opposite growth phenotypes of miR-9-3p and miR-9-5p mimics. Error bars represent SEMs of triplicate microplate wells. (E) Immunoblot showing the miR-9-3p-mediated reduction or miR-9-5p-mediated increase of phospho-ERK1/2 in the presence of 1.5 μM AZD6244 in MDA-MB-231 cells. (F) MDA-MB-231 or SUM159PT immunoblots showing a loss of c-MYC upon 48 h of 10 nM GSK1120212 treatment. (G) Immunoblots showing a sustained loss of c-MYC upon 96 h of miR-9-3p and AZD6244 dual treatment in MDA-MB-231 or SUM159PT cells. MDA-MB-231 cells were treated with 500 nM AZD6244, and SUM159PT cells were treated with 250 nM AZD6244. (H) MDA-MB-231 hemocytometer cell counts following transfection with control siRNA or three individual c-MYC siRNAs in the presence or absence of 500 nM AZD6244. Error bars represent SEMs of three experiments. *, P < 0.05 between control siRNA in the presence of AZD6244 and each individual MYC siRNA in the presence of AZD6244. Loading controls for all immunoblots were ERK2 and actin.

