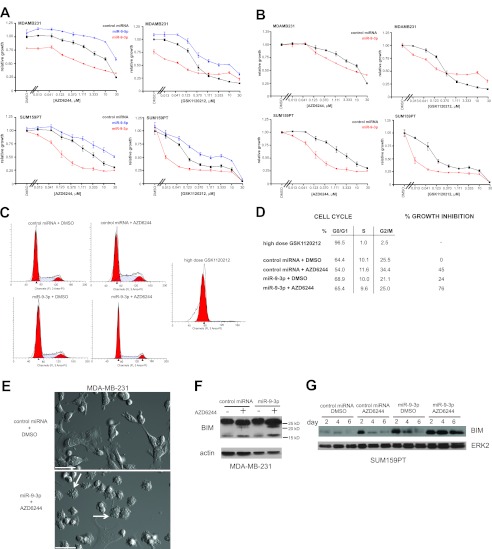
Fig 3.
miR-9-3p enhances MEK inhibitor-induced growth suppression. (A) Dose-response analysis for MDA-MB-231 cells or SUM159PT cells using the MEK inhibitor AZD6244 or GSK1120212 in the presence of control, miR-9-3p, or miR-9-5p miRNA mimics, showing growth attenuation with miR-9-3p and growth rescue with miR-9-5p. Cells were treated with drug and miRNA for 96 h prior to assaying cell viability by CellTiter-Glo luminescence, which was normalized to the value for control miRNA treated with DMSO. Error bars indicate SEMs of three experiments. (B) Dose-response curves as in panel A normalized to the value for each miRNA treated with DMSO separately for miR-9-3p or control miRNA. (C) DNA content determined by propidium iodide (PI) flow cytometry of SUM159PT cells 96 h after miR-9-3p or control miRNA treatment with or without 250 nM AZD6244. High-dose (500 nM) GSK1120212 was used as a positive control for the G0/G1 arrest induced by MEK inhibition. (D) Cell cycle stage quantification and percent growth inhibition from the flow cytometry data in panel C. (E) DIC image showing enhanced dynamic blebbing (arrows) after dual treatment of MDA-MB-231 cells with miR-9-3p and 500 nM AZD6244 for 96 h relative to control miRNA treated with DMSO condition. Bars = 50 μm. See Movie S1 in the supplemental material. (F) MDA-MB-231 cell blotting for endogenous BIM protein 96 h after transfection with the indicated miRNA mimics and treatment with 1.5 μM AZD6244 or DMSO. (G) BIM immunoblotting at 2, 4, and 6 days after transfection of SUM159PT cells with the indicated miRNA mimics and treatment with 500 nM AZD6244 or DMSO. Loading controls were actin or ERK2.

