
Fig 6.
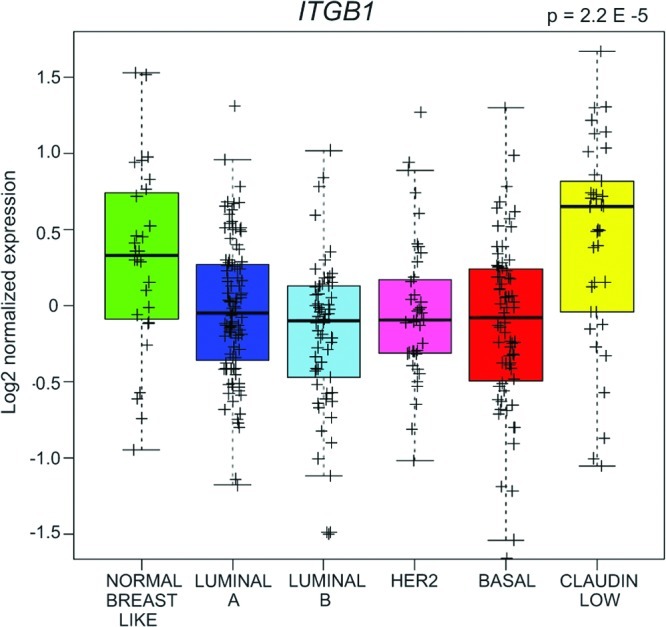
Elevated ITGB1 expression in human claudin-low tumors relative to tumors of the remaining indicated subtypes from the UNC337 gene array database. P = 2.2E−5 by the unequal variance t test; n = 337 tumors; whiskers = 1.5 interquartile range.
Official websites use .gov
A
.gov website belongs to an official
government organization in the United States.
Secure .gov websites use HTTPS
A lock (
) or https:// means you've safely
connected to the .gov website. Share sensitive
information only on official, secure websites.
Elevated ITGB1 expression in human claudin-low tumors relative to tumors of the remaining indicated subtypes from the UNC337 gene array database. P = 2.2E−5 by the unequal variance t test; n = 337 tumors; whiskers = 1.5 interquartile range.