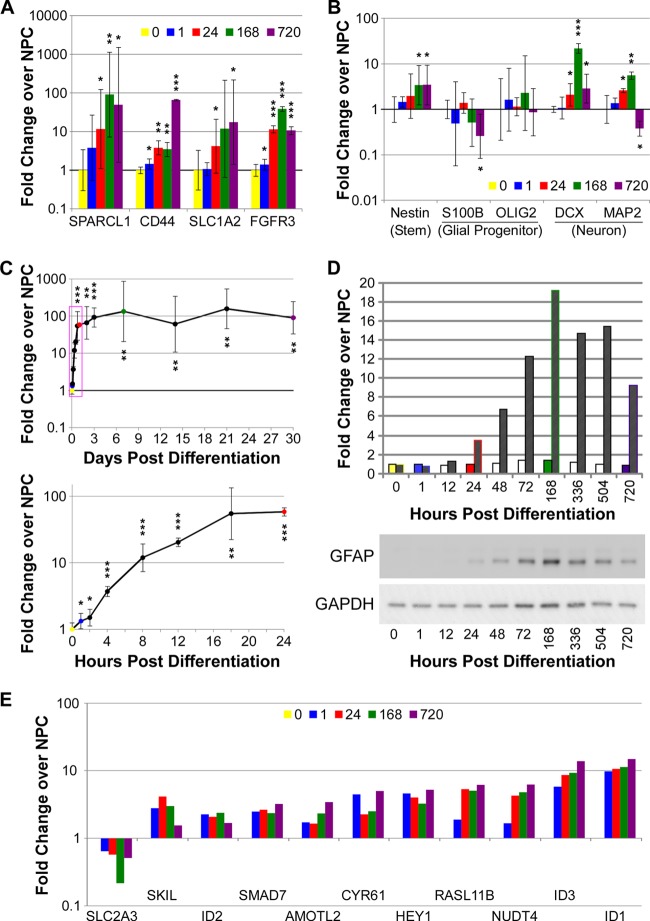
Fig 4.
Expression of RNA and protein markers during differentiation. (A) RT-PCR analysis of genes described as astrocyte markers, compared to neural progenitor cells (i.e., time zero). Numbers indicate hours postdifferentiation. Relative gene expression was determined compared to NPC expression (time zero) and normalized to β-actin expression. Error bars indicate 95% confidence interval (*, P < 0.05; **, P < 0.01; ***, P < 0.001). (B) RT-PCR analysis of change in gene expression, described as neural stem cell, glial progenitor, or neuronal markers, compared to neural progenitor cells (i.e., time zero). Relative gene expression was determined as for panel A. (C) Expression of GFAP RNA determined by RT-PCR. RNA was collected at the times depicted in Fig. 1. Relative gene expression was determined as for panel A. The red box indicated the region of expression expanded in the lower graph. (D) GFAP protein is upregulated during differentiation toward astrocytes. Protein was collected at the indicated hours and days during differentiation and visualized by Western blotting using Fluorchem Q software to analyze relative protein expression levels. Solid bars indicate relative GAPDH levels to time zero and indicate equal protein loading. Hatched bars indicate GFAP levels normalized to GAPDH levels and to levels in NPCs. (E) Microarray analysis of fold change in expression of genes continuously differentially regulated by 1 h postdifferentiation, normalized to expression in NPCs (i.e., time zero).

