
Fig 6.
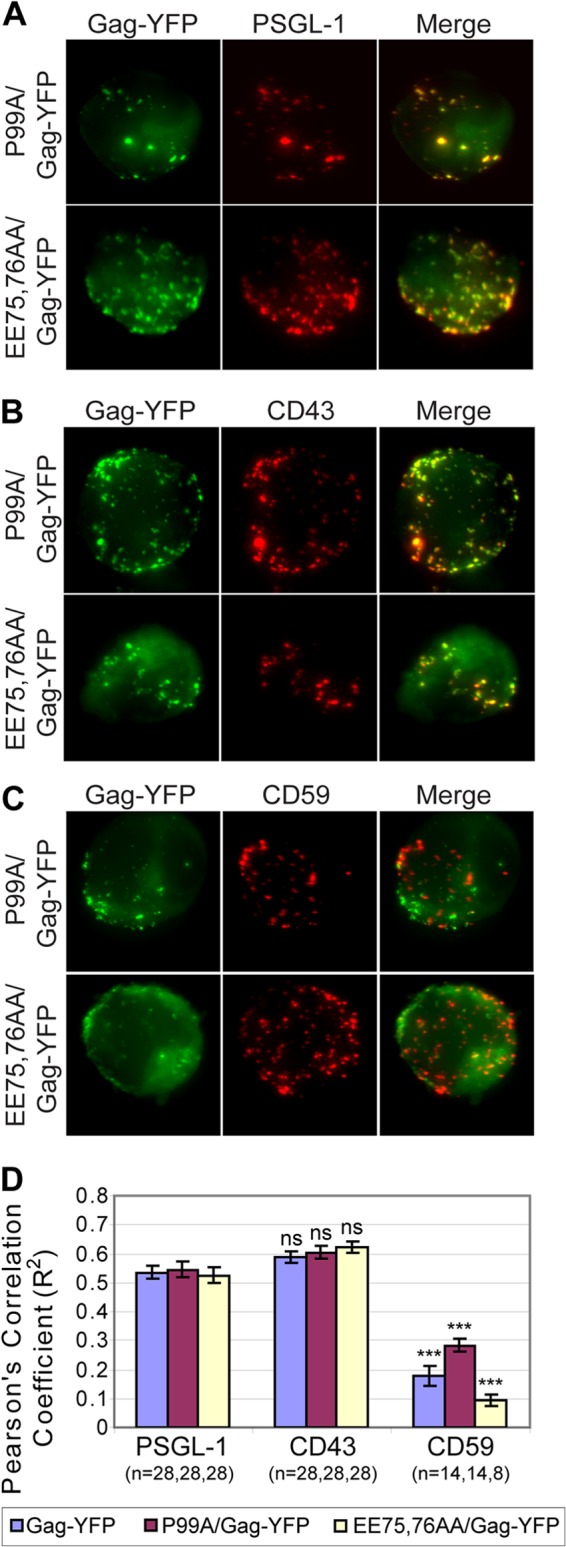
Membrane curvature is not required for specific UDM association. (A to C) P2 cells were infected with VSV-G-pseudotyped virus particles encoding the budding-deficient mutants P99A/Gag-YFP (top rows) and EE75,76AA/Gag-YFP (bottom rows). These cells were immunostained for PSGL-1 (A), CD43 (B), or CD59 (C) prior to fixation. Maximum projections reconstructed from z-stack images of cells are shown. (D) Copatching between Gag and uropod markers was quantified with the square of Pearson's correlation coefficient (R2). n, the number of cells used for quantification. Error bars represent standard errors of the means. P values were calculated based on comparisons between Gag copatching with PSGL-1 and other uropod markers. ***, P < 0.001; ns, not significant.